Australian vs Immigrants from Jordan In Labor Force | Age > 16
COMPARE
Australian
Immigrants from Jordan
In Labor Force | Age > 16
In Labor Force | Age > 16 Comparison
Australians
Immigrants from Jordan
65.3%
IN LABOR FORCE | AGE > 16
71.3/ 100
METRIC RATING
161st/ 347
METRIC RANK
66.1%
IN LABOR FORCE | AGE > 16
99.4/ 100
METRIC RATING
83rd/ 347
METRIC RANK
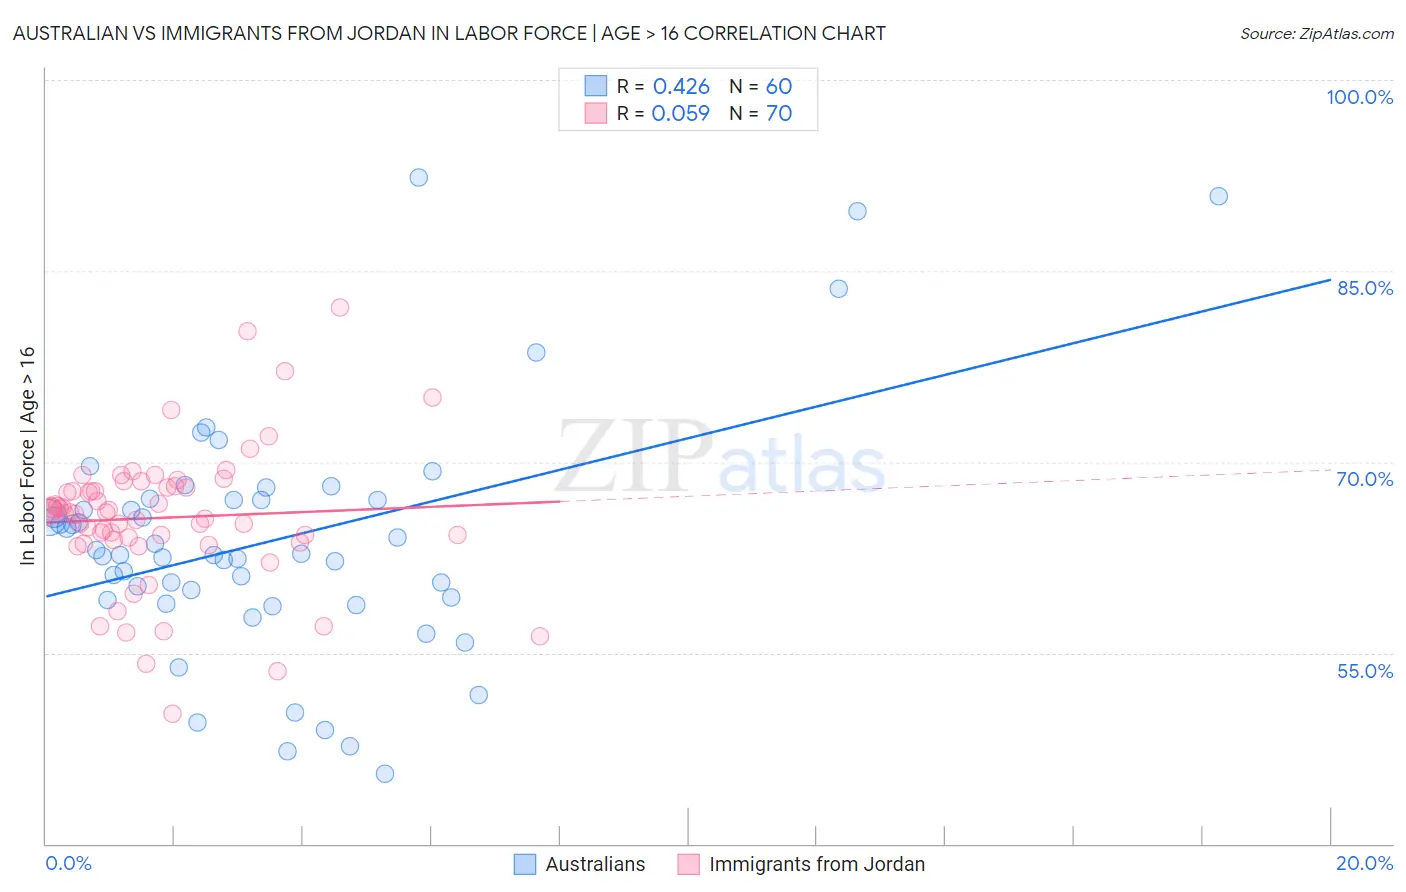
Australian vs Immigrants from Jordan In Labor Force | Age > 16 Correlation Chart
The statistical analysis conducted on geographies consisting of 224,163,192 people shows a moderate positive correlation between the proportion of Australians and labor force participation rate among population ages 16 and over in the United States with a correlation coefficient (R) of 0.426 and weighted average of 65.3%. Similarly, the statistical analysis conducted on geographies consisting of 181,280,783 people shows a slight positive correlation between the proportion of Immigrants from Jordan and labor force participation rate among population ages 16 and over in the United States with a correlation coefficient (R) of 0.059 and weighted average of 66.1%, a difference of 1.2%.
In Labor Force | Age > 16 Correlation Summary
| Measurement | Australian | Immigrants from Jordan |
| Minimum | 45.5% | 50.2% |
| Maximum | 92.3% | 82.1% |
| Range | 46.8% | 31.9% |
| Mean | 63.8% | 65.6% |
| Median | 62.8% | 66.0% |
| Interquartile 25% (IQ1) | 59.2% | 63.8% |
| Interquartile 75% (IQ3) | 67.0% | 68.0% |
| Interquartile Range (IQR) | 7.8% | 4.2% |
| Standard Deviation (Sample) | 9.5% | 5.5% |
| Standard Deviation (Population) | 9.4% | 5.4% |
Similar Demographics by In Labor Force | Age > 16
Demographics Similar to Australians by In Labor Force | Age > 16
In terms of in labor force | age > 16, the demographic groups most similar to Australians are Albanian (65.3%, a difference of 0.010%), South African (65.3%, a difference of 0.020%), Immigrants from South Africa (65.3%, a difference of 0.030%), Danish (65.3%, a difference of 0.030%), and Immigrants from Kazakhstan (65.3%, a difference of 0.040%).
| Demographics | Rating | Rank | In Labor Force | Age > 16 |
| Immigrants | Eastern Europe | 78.3 /100 | #154 | Good 65.4% |
| Immigrants | Armenia | 76.6 /100 | #155 | Good 65.3% |
| Immigrants | Ireland | 75.9 /100 | #156 | Good 65.3% |
| Immigrants | Russia | 75.7 /100 | #157 | Good 65.3% |
| Panamanians | 75.2 /100 | #158 | Good 65.3% |
| Immigrants | Syria | 74.6 /100 | #159 | Good 65.3% |
| Immigrants | South Africa | 73.5 /100 | #160 | Good 65.3% |
| Australians | 71.3 /100 | #161 | Good 65.3% |
| Albanians | 70.8 /100 | #162 | Good 65.3% |
| South Africans | 69.8 /100 | #163 | Good 65.3% |
| Danes | 68.8 /100 | #164 | Good 65.3% |
| Immigrants | Kazakhstan | 68.1 /100 | #165 | Good 65.3% |
| Immigrants | Western Asia | 67.3 /100 | #166 | Good 65.3% |
| Immigrants | Belarus | 66.0 /100 | #167 | Good 65.2% |
| Serbians | 63.5 /100 | #168 | Good 65.2% |
Demographics Similar to Immigrants from Jordan by In Labor Force | Age > 16
In terms of in labor force | age > 16, the demographic groups most similar to Immigrants from Jordan are German Russian (66.1%, a difference of 0.0%), Central American (66.1%, a difference of 0.0%), Moroccan (66.1%, a difference of 0.010%), Mongolian (66.1%, a difference of 0.020%), and South American (66.0%, a difference of 0.040%).
| Demographics | Rating | Rank | In Labor Force | Age > 16 |
| Immigrants | Malaysia | 99.6 /100 | #76 | Exceptional 66.1% |
| Immigrants | Moldova | 99.6 /100 | #77 | Exceptional 66.1% |
| Immigrants | Asia | 99.6 /100 | #78 | Exceptional 66.1% |
| Turks | 99.6 /100 | #79 | Exceptional 66.1% |
| Malaysians | 99.6 /100 | #80 | Exceptional 66.1% |
| Moroccans | 99.5 /100 | #81 | Exceptional 66.1% |
| German Russians | 99.4 /100 | #82 | Exceptional 66.1% |
| Immigrants | Jordan | 99.4 /100 | #83 | Exceptional 66.1% |
| Central Americans | 99.4 /100 | #84 | Exceptional 66.1% |
| Mongolians | 99.4 /100 | #85 | Exceptional 66.1% |
| South Americans | 99.4 /100 | #86 | Exceptional 66.0% |
| South American Indians | 99.4 /100 | #87 | Exceptional 66.0% |
| Bermudans | 99.3 /100 | #88 | Exceptional 66.0% |
| Immigrants | Laos | 99.2 /100 | #89 | Exceptional 66.0% |
| Chileans | 99.2 /100 | #90 | Exceptional 66.0% |