Assyrian/Chaldean/Syriac vs Kenyan Child Poverty Among Boys Under 16
COMPARE
Assyrian/Chaldean/Syriac
Kenyan
Child Poverty Among Boys Under 16
Child Poverty Among Boys Under 16 Comparison
Assyrians/Chaldeans/Syriacs
Kenyans
13.6%
CHILD POVERTY AMONG BOYS UNDER 16
99.8/ 100
METRIC RATING
34th/ 347
METRIC RANK
16.6%
CHILD POVERTY AMONG BOYS UNDER 16
41.0/ 100
METRIC RATING
183rd/ 347
METRIC RANK
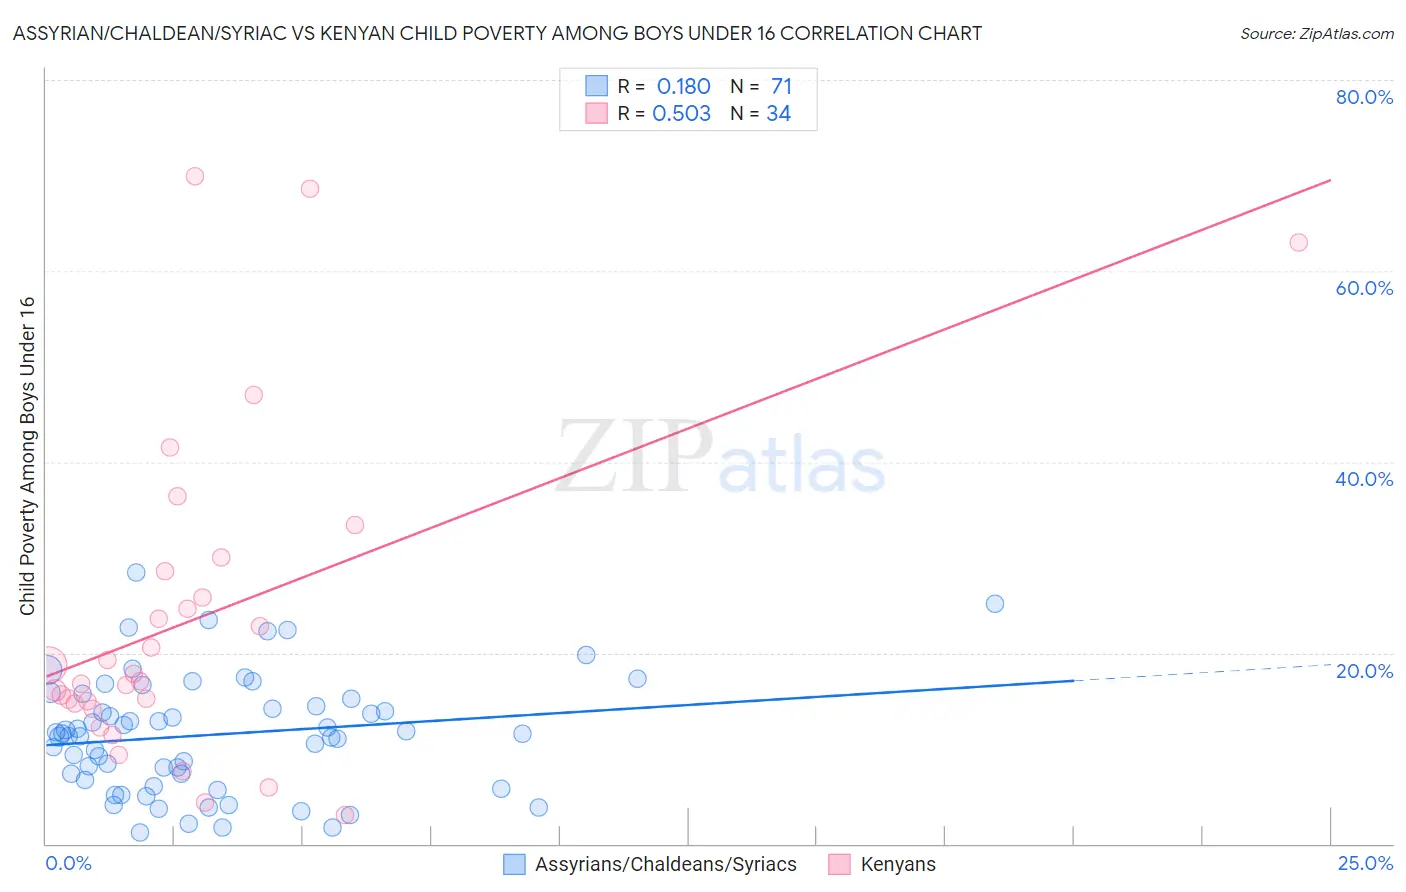
Assyrian/Chaldean/Syriac vs Kenyan Child Poverty Among Boys Under 16 Correlation Chart
The statistical analysis conducted on geographies consisting of 109,529,261 people shows a poor positive correlation between the proportion of Assyrians/Chaldeans/Syriacs and poverty level among boys under the age of 16 in the United States with a correlation coefficient (R) of 0.180 and weighted average of 13.6%. Similarly, the statistical analysis conducted on geographies consisting of 167,427,492 people shows a substantial positive correlation between the proportion of Kenyans and poverty level among boys under the age of 16 in the United States with a correlation coefficient (R) of 0.503 and weighted average of 16.6%, a difference of 21.8%.
Child Poverty Among Boys Under 16 Correlation Summary
| Measurement | Assyrian/Chaldean/Syriac | Kenyan |
| Minimum | 1.2% | 3.0% |
| Maximum | 28.5% | 70.0% |
| Range | 27.3% | 66.9% |
| Mean | 11.4% | 23.6% |
| Median | 11.5% | 17.5% |
| Interquartile 25% (IQ1) | 6.7% | 14.7% |
| Interquartile 75% (IQ3) | 15.2% | 28.5% |
| Interquartile Range (IQR) | 8.4% | 13.9% |
| Standard Deviation (Sample) | 6.1% | 17.0% |
| Standard Deviation (Population) | 6.0% | 16.7% |
Similar Demographics by Child Poverty Among Boys Under 16
Demographics Similar to Assyrians/Chaldeans/Syriacs by Child Poverty Among Boys Under 16
In terms of child poverty among boys under 16, the demographic groups most similar to Assyrians/Chaldeans/Syriacs are Danish (13.6%, a difference of 0.11%), Immigrants from China (13.6%, a difference of 0.29%), Turkish (13.6%, a difference of 0.38%), Swedish (13.6%, a difference of 0.46%), and Cypriot (13.6%, a difference of 0.55%).
| Demographics | Rating | Rank | Child Poverty Among Boys Under 16 |
| Asians | 99.8 /100 | #27 | Exceptional 13.5% |
| Eastern Europeans | 99.8 /100 | #28 | Exceptional 13.5% |
| Cypriots | 99.8 /100 | #29 | Exceptional 13.6% |
| Swedes | 99.8 /100 | #30 | Exceptional 13.6% |
| Turks | 99.8 /100 | #31 | Exceptional 13.6% |
| Immigrants | China | 99.8 /100 | #32 | Exceptional 13.6% |
| Danes | 99.8 /100 | #33 | Exceptional 13.6% |
| Assyrians/Chaldeans/Syriacs | 99.8 /100 | #34 | Exceptional 13.6% |
| Russians | 99.7 /100 | #35 | Exceptional 13.8% |
| Luxembourgers | 99.7 /100 | #36 | Exceptional 13.8% |
| Immigrants | Sri Lanka | 99.6 /100 | #37 | Exceptional 13.9% |
| Immigrants | Northern Europe | 99.6 /100 | #38 | Exceptional 13.9% |
| Immigrants | Australia | 99.6 /100 | #39 | Exceptional 13.9% |
| Immigrants | Asia | 99.6 /100 | #40 | Exceptional 13.9% |
| Lithuanians | 99.6 /100 | #41 | Exceptional 14.0% |
Demographics Similar to Kenyans by Child Poverty Among Boys Under 16
In terms of child poverty among boys under 16, the demographic groups most similar to Kenyans are Celtic (16.6%, a difference of 0.040%), Immigrants from Western Asia (16.6%, a difference of 0.070%), Lebanese (16.6%, a difference of 0.27%), Hmong (16.6%, a difference of 0.29%), and Immigrants from Costa Rica (16.7%, a difference of 0.37%).
| Demographics | Rating | Rank | Child Poverty Among Boys Under 16 |
| Whites/Caucasians | 48.2 /100 | #176 | Average 16.5% |
| Ethiopians | 47.8 /100 | #177 | Average 16.5% |
| Scotch-Irish | 47.5 /100 | #178 | Average 16.5% |
| Hungarians | 47.3 /100 | #179 | Average 16.5% |
| Hawaiians | 45.5 /100 | #180 | Average 16.5% |
| South American Indians | 44.3 /100 | #181 | Average 16.5% |
| Lebanese | 43.3 /100 | #182 | Average 16.6% |
| Kenyans | 41.0 /100 | #183 | Average 16.6% |
| Celtics | 40.6 /100 | #184 | Average 16.6% |
| Immigrants | Western Asia | 40.4 /100 | #185 | Average 16.6% |
| Hmong | 38.4 /100 | #186 | Fair 16.6% |
| Immigrants | Costa Rica | 37.8 /100 | #187 | Fair 16.7% |
| Immigrants | South America | 37.7 /100 | #188 | Fair 16.7% |
| Immigrants | Morocco | 34.5 /100 | #189 | Fair 16.7% |
| Arabs | 31.1 /100 | #190 | Fair 16.8% |