Assyrian/Chaldean/Syriac vs Japanese Child Poverty Among Boys Under 16
COMPARE
Assyrian/Chaldean/Syriac
Japanese
Child Poverty Among Boys Under 16
Child Poverty Among Boys Under 16 Comparison
Assyrians/Chaldeans/Syriacs
Japanese
13.6%
CHILD POVERTY AMONG BOYS UNDER 16
99.8/ 100
METRIC RATING
34th/ 347
METRIC RANK
17.7%
CHILD POVERTY AMONG BOYS UNDER 16
5.5/ 100
METRIC RATING
217th/ 347
METRIC RANK
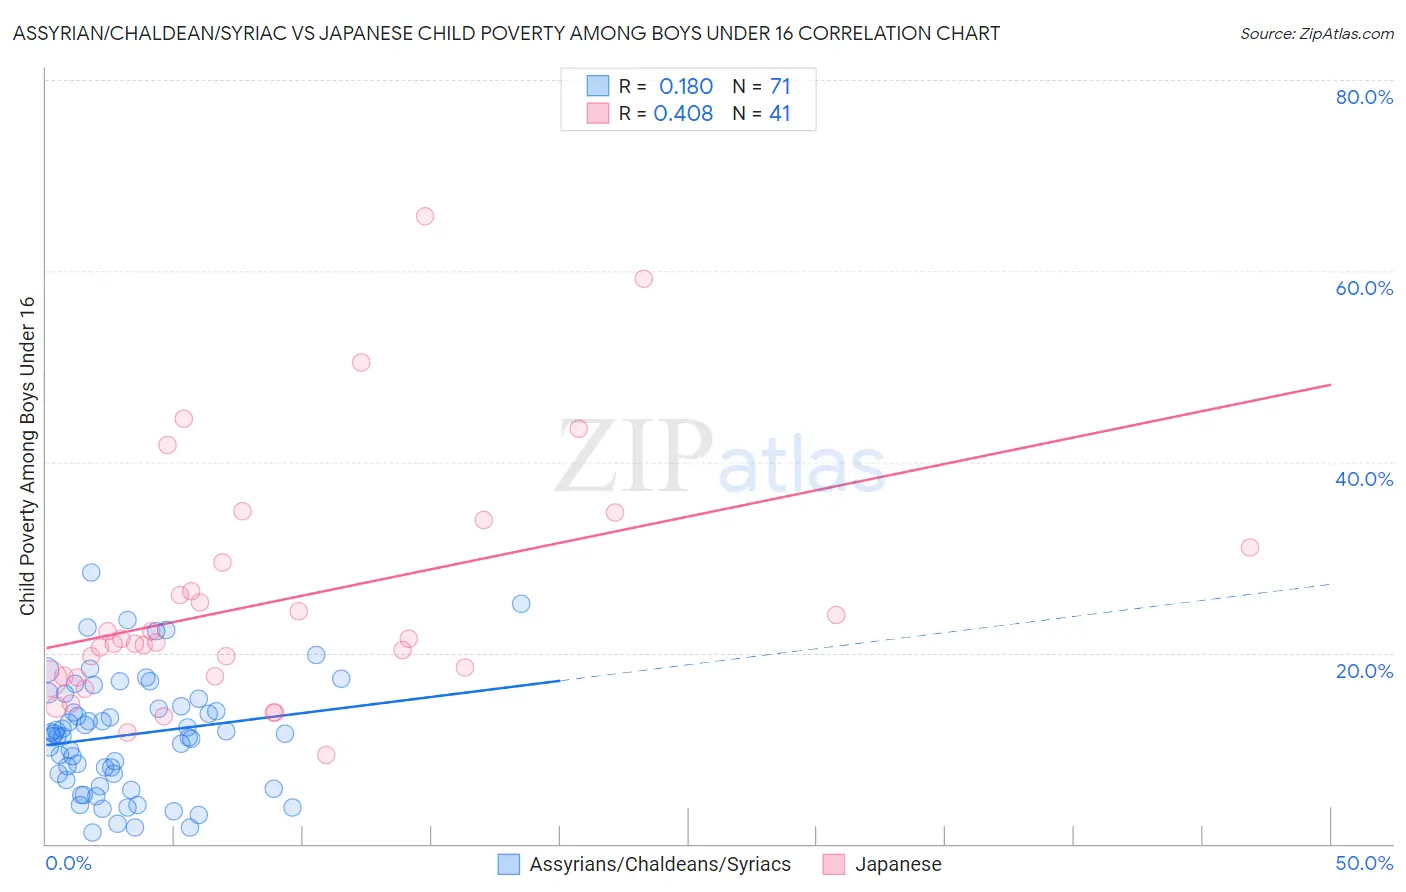
Assyrian/Chaldean/Syriac vs Japanese Child Poverty Among Boys Under 16 Correlation Chart
The statistical analysis conducted on geographies consisting of 109,529,261 people shows a poor positive correlation between the proportion of Assyrians/Chaldeans/Syriacs and poverty level among boys under the age of 16 in the United States with a correlation coefficient (R) of 0.180 and weighted average of 13.6%. Similarly, the statistical analysis conducted on geographies consisting of 247,557,395 people shows a moderate positive correlation between the proportion of Japanese and poverty level among boys under the age of 16 in the United States with a correlation coefficient (R) of 0.408 and weighted average of 17.7%, a difference of 30.1%.
Child Poverty Among Boys Under 16 Correlation Summary
| Measurement | Assyrian/Chaldean/Syriac | Japanese |
| Minimum | 1.2% | 9.3% |
| Maximum | 28.5% | 65.7% |
| Range | 27.3% | 56.4% |
| Mean | 11.4% | 25.4% |
| Median | 11.5% | 21.1% |
| Interquartile 25% (IQ1) | 6.7% | 17.5% |
| Interquartile 75% (IQ3) | 15.2% | 30.2% |
| Interquartile Range (IQR) | 8.4% | 12.7% |
| Standard Deviation (Sample) | 6.1% | 12.6% |
| Standard Deviation (Population) | 6.0% | 12.5% |
Similar Demographics by Child Poverty Among Boys Under 16
Demographics Similar to Assyrians/Chaldeans/Syriacs by Child Poverty Among Boys Under 16
In terms of child poverty among boys under 16, the demographic groups most similar to Assyrians/Chaldeans/Syriacs are Danish (13.6%, a difference of 0.11%), Immigrants from China (13.6%, a difference of 0.29%), Turkish (13.6%, a difference of 0.38%), Swedish (13.6%, a difference of 0.46%), and Cypriot (13.6%, a difference of 0.55%).
| Demographics | Rating | Rank | Child Poverty Among Boys Under 16 |
| Asians | 99.8 /100 | #27 | Exceptional 13.5% |
| Eastern Europeans | 99.8 /100 | #28 | Exceptional 13.5% |
| Cypriots | 99.8 /100 | #29 | Exceptional 13.6% |
| Swedes | 99.8 /100 | #30 | Exceptional 13.6% |
| Turks | 99.8 /100 | #31 | Exceptional 13.6% |
| Immigrants | China | 99.8 /100 | #32 | Exceptional 13.6% |
| Danes | 99.8 /100 | #33 | Exceptional 13.6% |
| Assyrians/Chaldeans/Syriacs | 99.8 /100 | #34 | Exceptional 13.6% |
| Russians | 99.7 /100 | #35 | Exceptional 13.8% |
| Luxembourgers | 99.7 /100 | #36 | Exceptional 13.8% |
| Immigrants | Sri Lanka | 99.6 /100 | #37 | Exceptional 13.9% |
| Immigrants | Northern Europe | 99.6 /100 | #38 | Exceptional 13.9% |
| Immigrants | Australia | 99.6 /100 | #39 | Exceptional 13.9% |
| Immigrants | Asia | 99.6 /100 | #40 | Exceptional 13.9% |
| Lithuanians | 99.6 /100 | #41 | Exceptional 14.0% |
Demographics Similar to Japanese by Child Poverty Among Boys Under 16
In terms of child poverty among boys under 16, the demographic groups most similar to Japanese are Iraqi (17.7%, a difference of 0.020%), Moroccan (17.7%, a difference of 0.030%), Sierra Leonean (17.8%, a difference of 0.10%), Osage (17.7%, a difference of 0.12%), and Panamanian (17.7%, a difference of 0.19%).
| Demographics | Rating | Rank | Child Poverty Among Boys Under 16 |
| Immigrants | Armenia | 6.8 /100 | #210 | Tragic 17.6% |
| Immigrants | Immigrants | 6.7 /100 | #211 | Tragic 17.6% |
| Aleuts | 6.6 /100 | #212 | Tragic 17.7% |
| Immigrants | Eastern Africa | 6.0 /100 | #213 | Tragic 17.7% |
| Panamanians | 5.9 /100 | #214 | Tragic 17.7% |
| Osage | 5.8 /100 | #215 | Tragic 17.7% |
| Moroccans | 5.6 /100 | #216 | Tragic 17.7% |
| Japanese | 5.5 /100 | #217 | Tragic 17.7% |
| Iraqis | 5.5 /100 | #218 | Tragic 17.7% |
| Sierra Leoneans | 5.3 /100 | #219 | Tragic 17.8% |
| Immigrants | Cambodia | 5.1 /100 | #220 | Tragic 17.8% |
| Immigrants | Panama | 4.3 /100 | #221 | Tragic 17.9% |
| Pennsylvania Germans | 3.9 /100 | #222 | Tragic 17.9% |
| Cubans | 3.8 /100 | #223 | Tragic 17.9% |
| Nepalese | 3.2 /100 | #224 | Tragic 18.0% |