Immigrants from Saudi Arabia vs Kenyan Child Poverty Among Boys Under 16
COMPARE
Immigrants from Saudi Arabia
Kenyan
Child Poverty Among Boys Under 16
Child Poverty Among Boys Under 16 Comparison
Immigrants from Saudi Arabia
Kenyans
16.4%
CHILD POVERTY AMONG BOYS UNDER 16
53.6/ 100
METRIC RATING
169th/ 347
METRIC RANK
16.6%
CHILD POVERTY AMONG BOYS UNDER 16
41.0/ 100
METRIC RATING
183rd/ 347
METRIC RANK
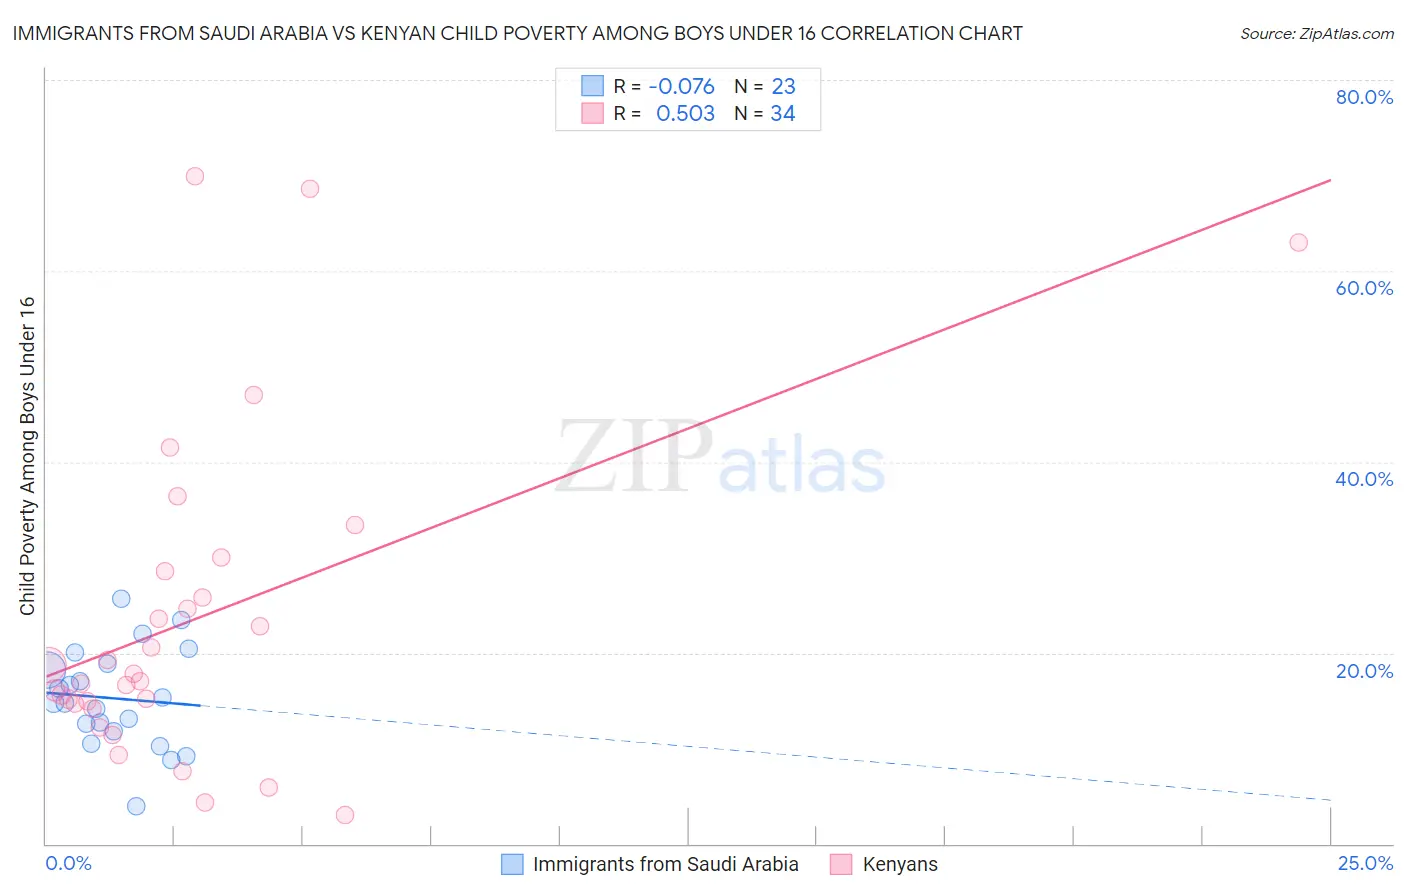
Immigrants from Saudi Arabia vs Kenyan Child Poverty Among Boys Under 16 Correlation Chart
The statistical analysis conducted on geographies consisting of 163,294,532 people shows a slight negative correlation between the proportion of Immigrants from Saudi Arabia and poverty level among boys under the age of 16 in the United States with a correlation coefficient (R) of -0.076 and weighted average of 16.4%. Similarly, the statistical analysis conducted on geographies consisting of 167,427,492 people shows a substantial positive correlation between the proportion of Kenyans and poverty level among boys under the age of 16 in the United States with a correlation coefficient (R) of 0.503 and weighted average of 16.6%, a difference of 1.4%.
Child Poverty Among Boys Under 16 Correlation Summary
| Measurement | Immigrants from Saudi Arabia | Kenyan |
| Minimum | 3.9% | 3.0% |
| Maximum | 25.7% | 70.0% |
| Range | 21.8% | 66.9% |
| Mean | 15.2% | 23.6% |
| Median | 14.8% | 17.5% |
| Interquartile 25% (IQ1) | 11.8% | 14.7% |
| Interquartile 75% (IQ3) | 18.9% | 28.5% |
| Interquartile Range (IQR) | 7.1% | 13.9% |
| Standard Deviation (Sample) | 5.2% | 17.0% |
| Standard Deviation (Population) | 5.1% | 16.7% |
Demographics Similar to Immigrants from Saudi Arabia and Kenyans by Child Poverty Among Boys Under 16
In terms of child poverty among boys under 16, the demographic groups most similar to Immigrants from Saudi Arabia are South American (16.3%, a difference of 0.19%), Afghan (16.3%, a difference of 0.20%), Immigrants from Bosnia and Herzegovina (16.4%, a difference of 0.21%), Immigrants from Ethiopia (16.4%, a difference of 0.27%), and Immigrants from Colombia (16.4%, a difference of 0.32%). Similarly, the demographic groups most similar to Kenyans are Celtic (16.6%, a difference of 0.040%), Immigrants from Western Asia (16.6%, a difference of 0.070%), Lebanese (16.6%, a difference of 0.27%), Hmong (16.6%, a difference of 0.29%), and South American Indian (16.5%, a difference of 0.38%).
| Demographics | Rating | Rank | Child Poverty Among Boys Under 16 |
| Immigrants | Germany | 63.6 /100 | #166 | Good 16.2% |
| Afghans | 55.4 /100 | #167 | Average 16.3% |
| South Americans | 55.3 /100 | #168 | Average 16.3% |
| Immigrants | Saudi Arabia | 53.6 /100 | #169 | Average 16.4% |
| Immigrants | Bosnia and Herzegovina | 51.7 /100 | #170 | Average 16.4% |
| Immigrants | Ethiopia | 51.3 /100 | #171 | Average 16.4% |
| Immigrants | Colombia | 50.8 /100 | #172 | Average 16.4% |
| Tsimshian | 50.5 /100 | #173 | Average 16.4% |
| Uruguayans | 50.0 /100 | #174 | Average 16.4% |
| Immigrants | Syria | 49.0 /100 | #175 | Average 16.5% |
| Whites/Caucasians | 48.2 /100 | #176 | Average 16.5% |
| Ethiopians | 47.8 /100 | #177 | Average 16.5% |
| Scotch-Irish | 47.5 /100 | #178 | Average 16.5% |
| Hungarians | 47.3 /100 | #179 | Average 16.5% |
| Hawaiians | 45.5 /100 | #180 | Average 16.5% |
| South American Indians | 44.3 /100 | #181 | Average 16.5% |
| Lebanese | 43.3 /100 | #182 | Average 16.6% |
| Kenyans | 41.0 /100 | #183 | Average 16.6% |
| Celtics | 40.6 /100 | #184 | Average 16.6% |
| Immigrants | Western Asia | 40.4 /100 | #185 | Average 16.6% |
| Hmong | 38.4 /100 | #186 | Fair 16.6% |