Guamanian/Chamorro vs Kenyan Child Poverty Among Boys Under 16
COMPARE
Guamanian/Chamorro
Kenyan
Child Poverty Among Boys Under 16
Child Poverty Among Boys Under 16 Comparison
Guamanians/Chamorros
Kenyans
16.1%
CHILD POVERTY AMONG BOYS UNDER 16
69.6/ 100
METRIC RATING
162nd/ 347
METRIC RANK
16.6%
CHILD POVERTY AMONG BOYS UNDER 16
41.0/ 100
METRIC RATING
183rd/ 347
METRIC RANK
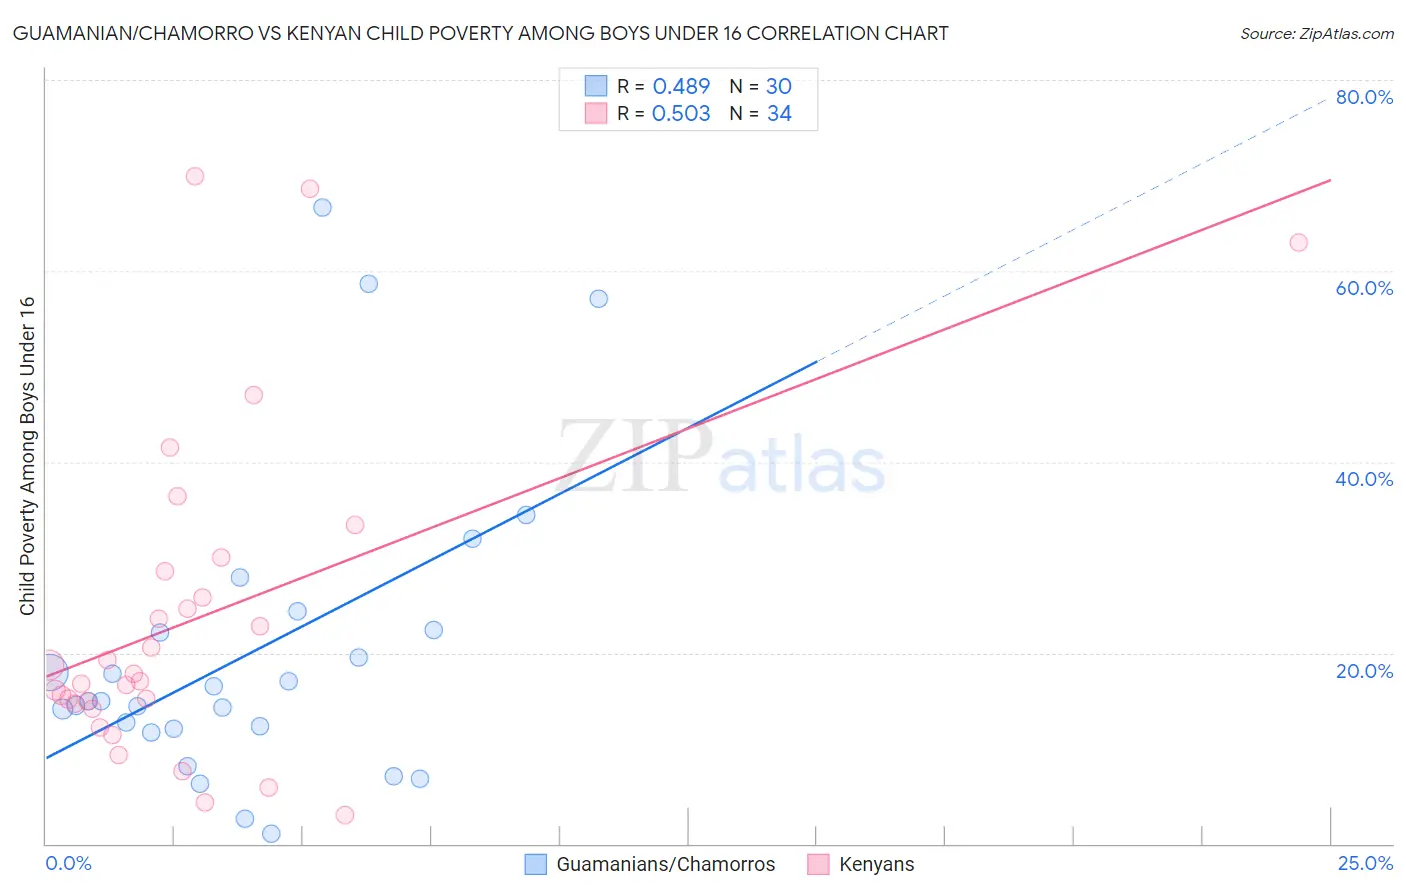
Guamanian/Chamorro vs Kenyan Child Poverty Among Boys Under 16 Correlation Chart
The statistical analysis conducted on geographies consisting of 220,488,068 people shows a moderate positive correlation between the proportion of Guamanians/Chamorros and poverty level among boys under the age of 16 in the United States with a correlation coefficient (R) of 0.489 and weighted average of 16.1%. Similarly, the statistical analysis conducted on geographies consisting of 167,427,492 people shows a substantial positive correlation between the proportion of Kenyans and poverty level among boys under the age of 16 in the United States with a correlation coefficient (R) of 0.503 and weighted average of 16.6%, a difference of 3.4%.
Child Poverty Among Boys Under 16 Correlation Summary
| Measurement | Guamanian/Chamorro | Kenyan |
| Minimum | 1.0% | 3.0% |
| Maximum | 66.7% | 70.0% |
| Range | 65.6% | 66.9% |
| Mean | 20.1% | 23.6% |
| Median | 14.9% | 17.5% |
| Interquartile 25% (IQ1) | 12.0% | 14.7% |
| Interquartile 75% (IQ3) | 22.4% | 28.5% |
| Interquartile Range (IQR) | 10.3% | 13.9% |
| Standard Deviation (Sample) | 15.8% | 17.0% |
| Standard Deviation (Population) | 15.6% | 16.7% |
Similar Demographics by Child Poverty Among Boys Under 16
Demographics Similar to Guamanians/Chamorros by Child Poverty Among Boys Under 16
In terms of child poverty among boys under 16, the demographic groups most similar to Guamanians/Chamorros are Costa Rican (16.1%, a difference of 0.20%), Immigrants from Albania (16.1%, a difference of 0.22%), Immigrants from Oceania (16.0%, a difference of 0.23%), Immigrants from Northern Africa (16.0%, a difference of 0.24%), and Colombian (16.1%, a difference of 0.58%).
| Demographics | Rating | Rank | Child Poverty Among Boys Under 16 |
| French Canadians | 76.6 /100 | #155 | Good 15.9% |
| Israelis | 76.5 /100 | #156 | Good 15.9% |
| Immigrants | Nepal | 76.0 /100 | #157 | Good 15.9% |
| Yugoslavians | 75.9 /100 | #158 | Good 15.9% |
| Immigrants | Chile | 74.8 /100 | #159 | Good 15.9% |
| Immigrants | Northern Africa | 71.3 /100 | #160 | Good 16.0% |
| Immigrants | Oceania | 71.3 /100 | #161 | Good 16.0% |
| Guamanians/Chamorros | 69.6 /100 | #162 | Good 16.1% |
| Costa Ricans | 68.1 /100 | #163 | Good 16.1% |
| Immigrants | Albania | 67.9 /100 | #164 | Good 16.1% |
| Colombians | 65.2 /100 | #165 | Good 16.1% |
| Immigrants | Germany | 63.6 /100 | #166 | Good 16.2% |
| Afghans | 55.4 /100 | #167 | Average 16.3% |
| South Americans | 55.3 /100 | #168 | Average 16.3% |
| Immigrants | Saudi Arabia | 53.6 /100 | #169 | Average 16.4% |
Demographics Similar to Kenyans by Child Poverty Among Boys Under 16
In terms of child poverty among boys under 16, the demographic groups most similar to Kenyans are Celtic (16.6%, a difference of 0.040%), Immigrants from Western Asia (16.6%, a difference of 0.070%), Lebanese (16.6%, a difference of 0.27%), Hmong (16.6%, a difference of 0.29%), and Immigrants from Costa Rica (16.7%, a difference of 0.37%).
| Demographics | Rating | Rank | Child Poverty Among Boys Under 16 |
| Whites/Caucasians | 48.2 /100 | #176 | Average 16.5% |
| Ethiopians | 47.8 /100 | #177 | Average 16.5% |
| Scotch-Irish | 47.5 /100 | #178 | Average 16.5% |
| Hungarians | 47.3 /100 | #179 | Average 16.5% |
| Hawaiians | 45.5 /100 | #180 | Average 16.5% |
| South American Indians | 44.3 /100 | #181 | Average 16.5% |
| Lebanese | 43.3 /100 | #182 | Average 16.6% |
| Kenyans | 41.0 /100 | #183 | Average 16.6% |
| Celtics | 40.6 /100 | #184 | Average 16.6% |
| Immigrants | Western Asia | 40.4 /100 | #185 | Average 16.6% |
| Hmong | 38.4 /100 | #186 | Fair 16.6% |
| Immigrants | Costa Rica | 37.8 /100 | #187 | Fair 16.7% |
| Immigrants | South America | 37.7 /100 | #188 | Fair 16.7% |
| Immigrants | Morocco | 34.5 /100 | #189 | Fair 16.7% |
| Arabs | 31.1 /100 | #190 | Fair 16.8% |