Assyrian/Chaldean/Syriac vs Swiss Child Poverty Among Boys Under 16
COMPARE
Assyrian/Chaldean/Syriac
Swiss
Child Poverty Among Boys Under 16
Child Poverty Among Boys Under 16 Comparison
Assyrians/Chaldeans/Syriacs
Swiss
13.6%
CHILD POVERTY AMONG BOYS UNDER 16
99.8/ 100
METRIC RATING
34th/ 347
METRIC RANK
14.8%
CHILD POVERTY AMONG BOYS UNDER 16
97.3/ 100
METRIC RATING
84th/ 347
METRIC RANK
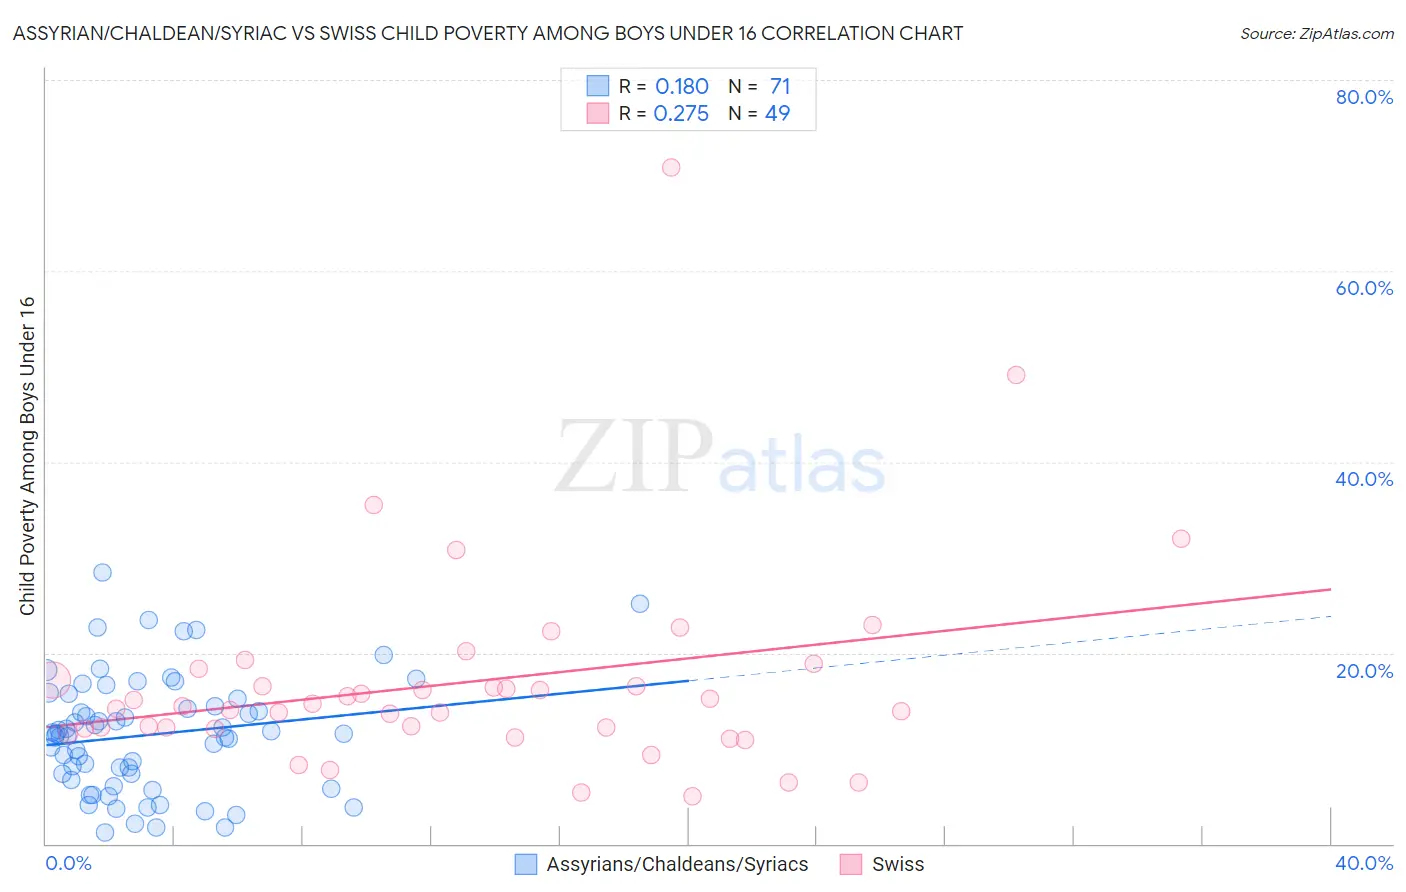
Assyrian/Chaldean/Syriac vs Swiss Child Poverty Among Boys Under 16 Correlation Chart
The statistical analysis conducted on geographies consisting of 109,529,261 people shows a poor positive correlation between the proportion of Assyrians/Chaldeans/Syriacs and poverty level among boys under the age of 16 in the United States with a correlation coefficient (R) of 0.180 and weighted average of 13.6%. Similarly, the statistical analysis conducted on geographies consisting of 453,201,840 people shows a weak positive correlation between the proportion of Swiss and poverty level among boys under the age of 16 in the United States with a correlation coefficient (R) of 0.275 and weighted average of 14.8%, a difference of 8.5%.
Child Poverty Among Boys Under 16 Correlation Summary
| Measurement | Assyrian/Chaldean/Syriac | Swiss |
| Minimum | 1.2% | 5.0% |
| Maximum | 28.5% | 70.8% |
| Range | 27.3% | 65.8% |
| Mean | 11.4% | 16.9% |
| Median | 11.5% | 14.4% |
| Interquartile 25% (IQ1) | 6.7% | 12.1% |
| Interquartile 75% (IQ3) | 15.2% | 17.7% |
| Interquartile Range (IQR) | 8.4% | 5.6% |
| Standard Deviation (Sample) | 6.1% | 11.1% |
| Standard Deviation (Population) | 6.0% | 11.0% |
Similar Demographics by Child Poverty Among Boys Under 16
Demographics Similar to Assyrians/Chaldeans/Syriacs by Child Poverty Among Boys Under 16
In terms of child poverty among boys under 16, the demographic groups most similar to Assyrians/Chaldeans/Syriacs are Danish (13.6%, a difference of 0.11%), Immigrants from China (13.6%, a difference of 0.29%), Turkish (13.6%, a difference of 0.38%), Swedish (13.6%, a difference of 0.46%), and Cypriot (13.6%, a difference of 0.55%).
| Demographics | Rating | Rank | Child Poverty Among Boys Under 16 |
| Asians | 99.8 /100 | #27 | Exceptional 13.5% |
| Eastern Europeans | 99.8 /100 | #28 | Exceptional 13.5% |
| Cypriots | 99.8 /100 | #29 | Exceptional 13.6% |
| Swedes | 99.8 /100 | #30 | Exceptional 13.6% |
| Turks | 99.8 /100 | #31 | Exceptional 13.6% |
| Immigrants | China | 99.8 /100 | #32 | Exceptional 13.6% |
| Danes | 99.8 /100 | #33 | Exceptional 13.6% |
| Assyrians/Chaldeans/Syriacs | 99.8 /100 | #34 | Exceptional 13.6% |
| Russians | 99.7 /100 | #35 | Exceptional 13.8% |
| Luxembourgers | 99.7 /100 | #36 | Exceptional 13.8% |
| Immigrants | Sri Lanka | 99.6 /100 | #37 | Exceptional 13.9% |
| Immigrants | Northern Europe | 99.6 /100 | #38 | Exceptional 13.9% |
| Immigrants | Australia | 99.6 /100 | #39 | Exceptional 13.9% |
| Immigrants | Asia | 99.6 /100 | #40 | Exceptional 13.9% |
| Lithuanians | 99.6 /100 | #41 | Exceptional 14.0% |
Demographics Similar to Swiss by Child Poverty Among Boys Under 16
In terms of child poverty among boys under 16, the demographic groups most similar to Swiss are Taiwanese (14.8%, a difference of 0.040%), German (14.8%, a difference of 0.11%), Immigrants from South Africa (14.8%, a difference of 0.12%), Northern European (14.8%, a difference of 0.16%), and Immigrants from North America (14.8%, a difference of 0.18%).
| Demographics | Rating | Rank | Child Poverty Among Boys Under 16 |
| Macedonians | 97.9 /100 | #77 | Exceptional 14.7% |
| Egyptians | 97.8 /100 | #78 | Exceptional 14.7% |
| Immigrants | Eastern Europe | 97.8 /100 | #79 | Exceptional 14.7% |
| Immigrants | Russia | 97.7 /100 | #80 | Exceptional 14.7% |
| Immigrants | Canada | 97.6 /100 | #81 | Exceptional 14.7% |
| Ukrainians | 97.6 /100 | #82 | Exceptional 14.7% |
| Immigrants | South Africa | 97.4 /100 | #83 | Exceptional 14.8% |
| Swiss | 97.3 /100 | #84 | Exceptional 14.8% |
| Taiwanese | 97.3 /100 | #85 | Exceptional 14.8% |
| Germans | 97.2 /100 | #86 | Exceptional 14.8% |
| Northern Europeans | 97.2 /100 | #87 | Exceptional 14.8% |
| Immigrants | North America | 97.1 /100 | #88 | Exceptional 14.8% |
| Immigrants | Argentina | 97.1 /100 | #89 | Exceptional 14.8% |
| Austrians | 97.1 /100 | #90 | Exceptional 14.8% |
| Paraguayans | 96.8 /100 | #91 | Exceptional 14.9% |