Haitian vs Kenyan Child Poverty Among Boys Under 16
COMPARE
Haitian
Kenyan
Child Poverty Among Boys Under 16
Child Poverty Among Boys Under 16 Comparison
Haitians
Kenyans
21.0%
CHILD POVERTY AMONG BOYS UNDER 16
0.0/ 100
METRIC RATING
300th/ 347
METRIC RANK
16.6%
CHILD POVERTY AMONG BOYS UNDER 16
41.0/ 100
METRIC RATING
183rd/ 347
METRIC RANK
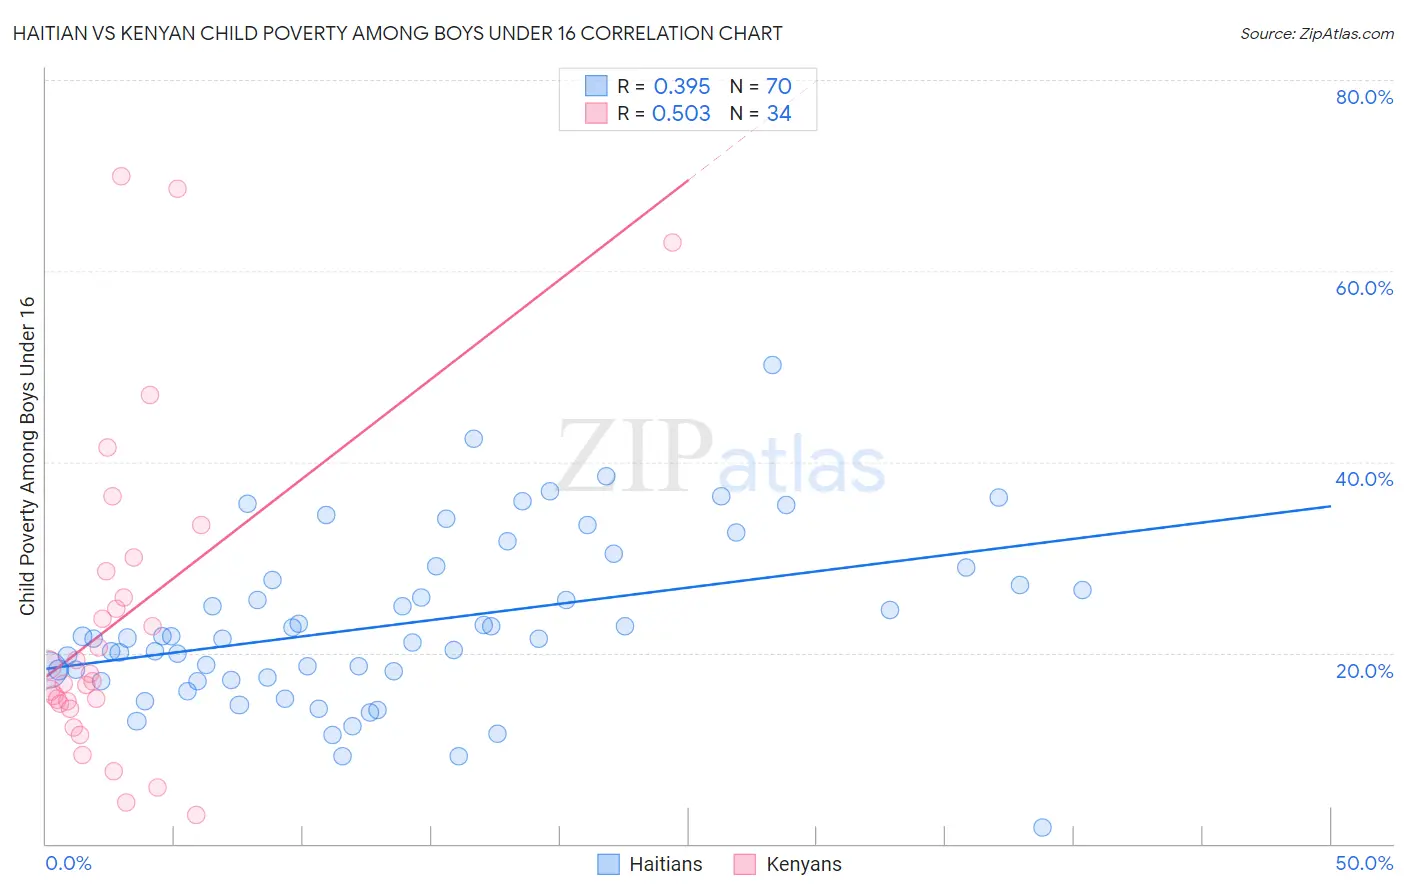
Haitian vs Kenyan Child Poverty Among Boys Under 16 Correlation Chart
The statistical analysis conducted on geographies consisting of 284,969,513 people shows a mild positive correlation between the proportion of Haitians and poverty level among boys under the age of 16 in the United States with a correlation coefficient (R) of 0.395 and weighted average of 21.0%. Similarly, the statistical analysis conducted on geographies consisting of 167,427,492 people shows a substantial positive correlation between the proportion of Kenyans and poverty level among boys under the age of 16 in the United States with a correlation coefficient (R) of 0.503 and weighted average of 16.6%, a difference of 26.7%.
Child Poverty Among Boys Under 16 Correlation Summary
| Measurement | Haitian | Kenyan |
| Minimum | 1.7% | 3.0% |
| Maximum | 50.2% | 70.0% |
| Range | 48.5% | 66.9% |
| Mean | 23.0% | 23.6% |
| Median | 21.5% | 17.5% |
| Interquartile 25% (IQ1) | 17.4% | 14.7% |
| Interquartile 75% (IQ3) | 27.7% | 28.5% |
| Interquartile Range (IQR) | 10.3% | 13.9% |
| Standard Deviation (Sample) | 8.8% | 17.0% |
| Standard Deviation (Population) | 8.7% | 16.7% |
Similar Demographics by Child Poverty Among Boys Under 16
Demographics Similar to Haitians by Child Poverty Among Boys Under 16
In terms of child poverty among boys under 16, the demographic groups most similar to Haitians are Immigrants from Caribbean (21.0%, a difference of 0.050%), Chippewa (21.0%, a difference of 0.32%), Guatemalan (21.1%, a difference of 0.54%), Somali (21.1%, a difference of 0.54%), and Hispanic or Latino (20.9%, a difference of 0.58%).
| Demographics | Rating | Rank | Child Poverty Among Boys Under 16 |
| Immigrants | Senegal | 0.0 /100 | #293 | Tragic 20.7% |
| Immigrants | Bahamas | 0.0 /100 | #294 | Tragic 20.7% |
| Mexicans | 0.0 /100 | #295 | Tragic 20.7% |
| Indonesians | 0.0 /100 | #296 | Tragic 20.8% |
| Hispanics or Latinos | 0.0 /100 | #297 | Tragic 20.9% |
| Chippewa | 0.0 /100 | #298 | Tragic 21.0% |
| Immigrants | Caribbean | 0.0 /100 | #299 | Tragic 21.0% |
| Haitians | 0.0 /100 | #300 | Tragic 21.0% |
| Guatemalans | 0.0 /100 | #301 | Tragic 21.1% |
| Somalis | 0.0 /100 | #302 | Tragic 21.1% |
| Immigrants | Haiti | 0.0 /100 | #303 | Tragic 21.3% |
| Immigrants | Central America | 0.0 /100 | #304 | Tragic 21.3% |
| Kiowa | 0.0 /100 | #305 | Tragic 21.3% |
| Immigrants | Grenada | 0.0 /100 | #306 | Tragic 21.3% |
| Choctaw | 0.0 /100 | #307 | Tragic 21.3% |
Demographics Similar to Kenyans by Child Poverty Among Boys Under 16
In terms of child poverty among boys under 16, the demographic groups most similar to Kenyans are Celtic (16.6%, a difference of 0.040%), Immigrants from Western Asia (16.6%, a difference of 0.070%), Lebanese (16.6%, a difference of 0.27%), Hmong (16.6%, a difference of 0.29%), and Immigrants from Costa Rica (16.7%, a difference of 0.37%).
| Demographics | Rating | Rank | Child Poverty Among Boys Under 16 |
| Whites/Caucasians | 48.2 /100 | #176 | Average 16.5% |
| Ethiopians | 47.8 /100 | #177 | Average 16.5% |
| Scotch-Irish | 47.5 /100 | #178 | Average 16.5% |
| Hungarians | 47.3 /100 | #179 | Average 16.5% |
| Hawaiians | 45.5 /100 | #180 | Average 16.5% |
| South American Indians | 44.3 /100 | #181 | Average 16.5% |
| Lebanese | 43.3 /100 | #182 | Average 16.6% |
| Kenyans | 41.0 /100 | #183 | Average 16.6% |
| Celtics | 40.6 /100 | #184 | Average 16.6% |
| Immigrants | Western Asia | 40.4 /100 | #185 | Average 16.6% |
| Hmong | 38.4 /100 | #186 | Fair 16.6% |
| Immigrants | Costa Rica | 37.8 /100 | #187 | Fair 16.7% |
| Immigrants | South America | 37.7 /100 | #188 | Fair 16.7% |
| Immigrants | Morocco | 34.5 /100 | #189 | Fair 16.7% |
| Arabs | 31.1 /100 | #190 | Fair 16.8% |