Assyrian/Chaldean/Syriac vs Immigrants from Indonesia Child Poverty Among Boys Under 16
COMPARE
Assyrian/Chaldean/Syriac
Immigrants from Indonesia
Child Poverty Among Boys Under 16
Child Poverty Among Boys Under 16 Comparison
Assyrians/Chaldeans/Syriacs
Immigrants from Indonesia
13.6%
CHILD POVERTY AMONG BOYS UNDER 16
99.8/ 100
METRIC RATING
34th/ 347
METRIC RANK
14.1%
CHILD POVERTY AMONG BOYS UNDER 16
99.4/ 100
METRIC RATING
48th/ 347
METRIC RANK
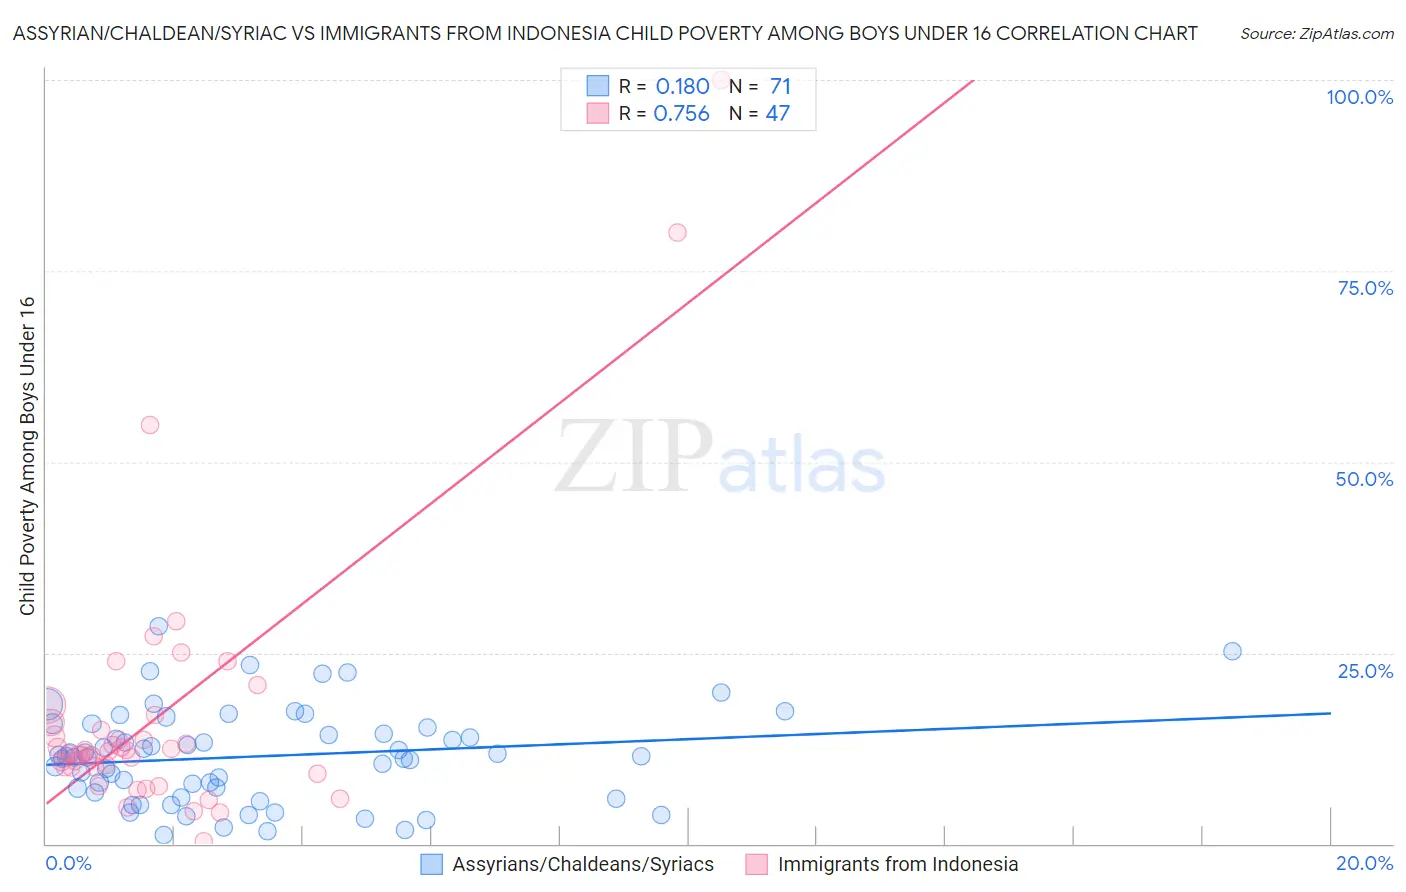
Assyrian/Chaldean/Syriac vs Immigrants from Indonesia Child Poverty Among Boys Under 16 Correlation Chart
The statistical analysis conducted on geographies consisting of 109,529,261 people shows a poor positive correlation between the proportion of Assyrians/Chaldeans/Syriacs and poverty level among boys under the age of 16 in the United States with a correlation coefficient (R) of 0.180 and weighted average of 13.6%. Similarly, the statistical analysis conducted on geographies consisting of 214,005,757 people shows a strong positive correlation between the proportion of Immigrants from Indonesia and poverty level among boys under the age of 16 in the United States with a correlation coefficient (R) of 0.756 and weighted average of 14.1%, a difference of 3.6%.
Child Poverty Among Boys Under 16 Correlation Summary
| Measurement | Assyrian/Chaldean/Syriac | Immigrants from Indonesia |
| Minimum | 1.2% | 0.40% |
| Maximum | 28.5% | 100.0% |
| Range | 27.3% | 99.6% |
| Mean | 11.4% | 16.7% |
| Median | 11.5% | 12.1% |
| Interquartile 25% (IQ1) | 6.7% | 9.9% |
| Interquartile 75% (IQ3) | 15.2% | 15.9% |
| Interquartile Range (IQR) | 8.4% | 5.9% |
| Standard Deviation (Sample) | 6.1% | 17.9% |
| Standard Deviation (Population) | 6.0% | 17.7% |
Demographics Similar to Assyrians/Chaldeans/Syriacs and Immigrants from Indonesia by Child Poverty Among Boys Under 16
In terms of child poverty among boys under 16, the demographic groups most similar to Assyrians/Chaldeans/Syriacs are Danish (13.6%, a difference of 0.11%), Immigrants from China (13.6%, a difference of 0.29%), Turkish (13.6%, a difference of 0.38%), Russian (13.8%, a difference of 1.0%), and Luxembourger (13.8%, a difference of 1.3%). Similarly, the demographic groups most similar to Immigrants from Indonesia are Immigrants from Moldova (14.1%, a difference of 0.020%), Czech (14.1%, a difference of 0.090%), Greek (14.1%, a difference of 0.29%), Immigrants from Scotland (14.1%, a difference of 0.39%), and Estonian (14.1%, a difference of 0.49%).
| Demographics | Rating | Rank | Child Poverty Among Boys Under 16 |
| Turks | 99.8 /100 | #31 | Exceptional 13.6% |
| Immigrants | China | 99.8 /100 | #32 | Exceptional 13.6% |
| Danes | 99.8 /100 | #33 | Exceptional 13.6% |
| Assyrians/Chaldeans/Syriacs | 99.8 /100 | #34 | Exceptional 13.6% |
| Russians | 99.7 /100 | #35 | Exceptional 13.8% |
| Luxembourgers | 99.7 /100 | #36 | Exceptional 13.8% |
| Immigrants | Sri Lanka | 99.6 /100 | #37 | Exceptional 13.9% |
| Immigrants | Northern Europe | 99.6 /100 | #38 | Exceptional 13.9% |
| Immigrants | Australia | 99.6 /100 | #39 | Exceptional 13.9% |
| Immigrants | Asia | 99.6 /100 | #40 | Exceptional 13.9% |
| Lithuanians | 99.6 /100 | #41 | Exceptional 14.0% |
| Koreans | 99.6 /100 | #42 | Exceptional 14.0% |
| Croatians | 99.5 /100 | #43 | Exceptional 14.0% |
| Estonians | 99.4 /100 | #44 | Exceptional 14.1% |
| Immigrants | Scotland | 99.4 /100 | #45 | Exceptional 14.1% |
| Greeks | 99.4 /100 | #46 | Exceptional 14.1% |
| Immigrants | Moldova | 99.4 /100 | #47 | Exceptional 14.1% |
| Immigrants | Indonesia | 99.4 /100 | #48 | Exceptional 14.1% |
| Czechs | 99.3 /100 | #49 | Exceptional 14.1% |
| Italians | 99.2 /100 | #50 | Exceptional 14.2% |
| Immigrants | Greece | 99.2 /100 | #51 | Exceptional 14.2% |