Immigrants from Saudi Arabia vs Immigrants from Cameroon Single Female Poverty
COMPARE
Immigrants from Saudi Arabia
Immigrants from Cameroon
Single Female Poverty
Single Female Poverty Comparison
Immigrants from Saudi Arabia
Immigrants from Cameroon
21.3%
SINGLE FEMALE POVERTY
27.1/ 100
METRIC RATING
196th/ 347
METRIC RANK
19.8%
SINGLE FEMALE POVERTY
97.3/ 100
METRIC RATING
102nd/ 347
METRIC RANK
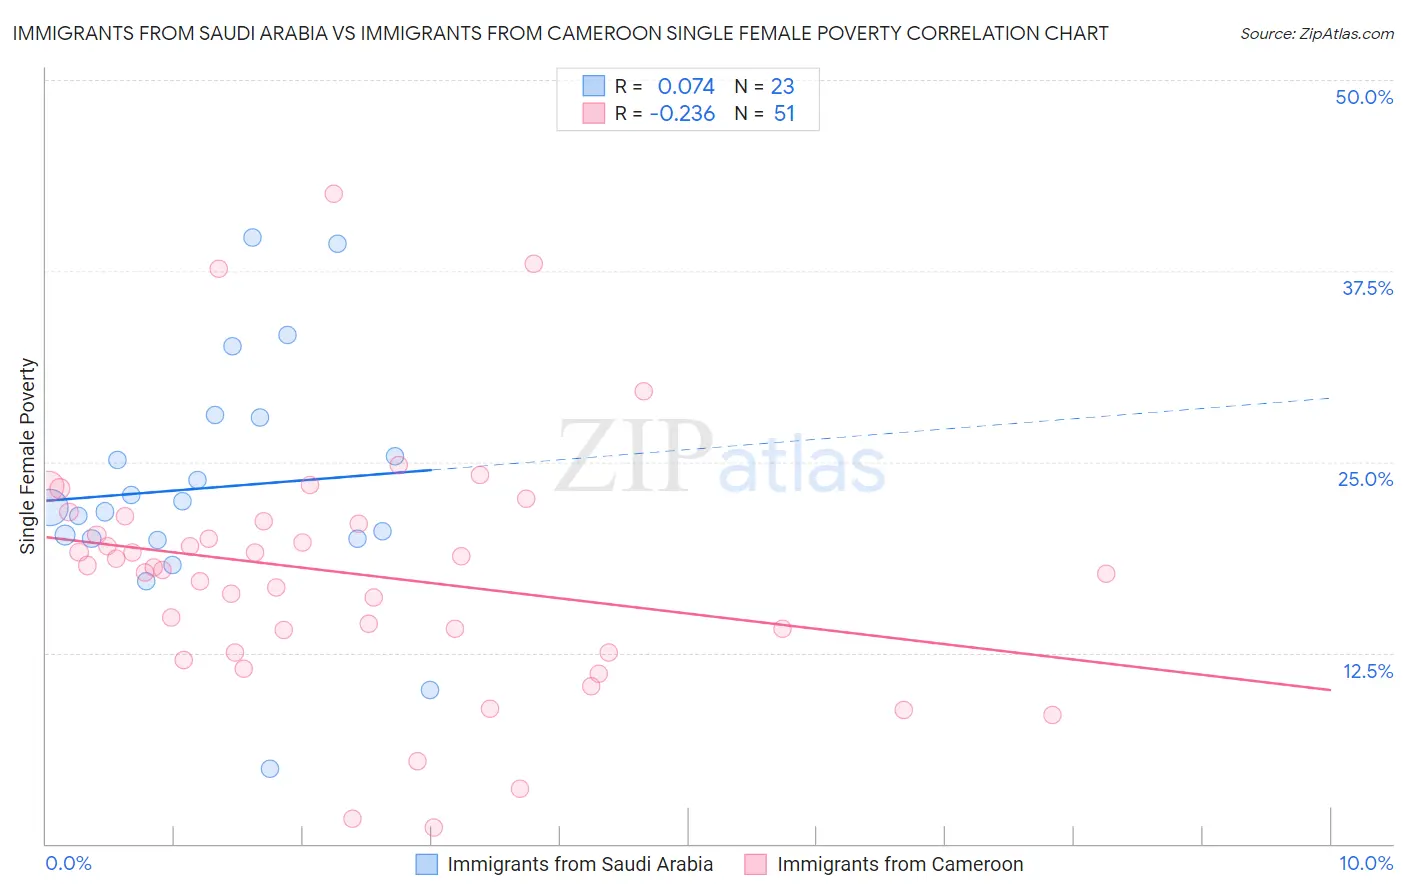
Immigrants from Saudi Arabia vs Immigrants from Cameroon Single Female Poverty Correlation Chart
The statistical analysis conducted on geographies consisting of 163,330,182 people shows a slight positive correlation between the proportion of Immigrants from Saudi Arabia and poverty level among single females in the United States with a correlation coefficient (R) of 0.074 and weighted average of 21.3%. Similarly, the statistical analysis conducted on geographies consisting of 130,300,683 people shows a weak negative correlation between the proportion of Immigrants from Cameroon and poverty level among single females in the United States with a correlation coefficient (R) of -0.236 and weighted average of 19.8%, a difference of 7.5%.
Single Female Poverty Correlation Summary
| Measurement | Immigrants from Saudi Arabia | Immigrants from Cameroon |
| Minimum | 4.9% | 1.1% |
| Maximum | 39.7% | 42.6% |
| Range | 34.8% | 41.5% |
| Mean | 23.3% | 17.7% |
| Median | 22.0% | 18.1% |
| Interquartile 25% (IQ1) | 20.0% | 12.5% |
| Interquartile 75% (IQ3) | 27.9% | 21.1% |
| Interquartile Range (IQR) | 7.9% | 8.5% |
| Standard Deviation (Sample) | 8.0% | 8.1% |
| Standard Deviation (Population) | 7.8% | 8.0% |
Similar Demographics by Single Female Poverty
Demographics Similar to Immigrants from Saudi Arabia by Single Female Poverty
In terms of single female poverty, the demographic groups most similar to Immigrants from Saudi Arabia are Nicaraguan (21.3%, a difference of 0.040%), Czechoslovakian (21.3%, a difference of 0.050%), Japanese (21.3%, a difference of 0.060%), Basque (21.3%, a difference of 0.070%), and Swiss (21.4%, a difference of 0.23%).
| Demographics | Rating | Rank | Single Female Poverty |
| Immigrants | Cuba | 35.3 /100 | #189 | Fair 21.2% |
| Trinidadians and Tobagonians | 35.2 /100 | #190 | Fair 21.2% |
| Immigrants | Germany | 31.1 /100 | #191 | Fair 21.3% |
| Immigrants | Jamaica | 30.5 /100 | #192 | Fair 21.3% |
| Basques | 28.1 /100 | #193 | Fair 21.3% |
| Czechoslovakians | 27.7 /100 | #194 | Fair 21.3% |
| Nicaraguans | 27.6 /100 | #195 | Fair 21.3% |
| Immigrants | Saudi Arabia | 27.1 /100 | #196 | Fair 21.3% |
| Japanese | 26.4 /100 | #197 | Fair 21.3% |
| Swiss | 24.2 /100 | #198 | Fair 21.4% |
| Immigrants | Immigrants | 22.0 /100 | #199 | Fair 21.4% |
| Irish | 21.4 /100 | #200 | Fair 21.4% |
| Nigerians | 20.9 /100 | #201 | Fair 21.4% |
| Immigrants | Kenya | 20.7 /100 | #202 | Fair 21.4% |
| Immigrants | Haiti | 18.8 /100 | #203 | Poor 21.5% |
Demographics Similar to Immigrants from Cameroon by Single Female Poverty
In terms of single female poverty, the demographic groups most similar to Immigrants from Cameroon are Immigrants from Belgium (19.8%, a difference of 0.010%), Immigrants from Southern Europe (19.9%, a difference of 0.12%), Ukrainian (19.8%, a difference of 0.19%), Chilean (19.9%, a difference of 0.24%), and Israeli (19.9%, a difference of 0.25%).
| Demographics | Rating | Rank | Single Female Poverty |
| Estonians | 98.2 /100 | #95 | Exceptional 19.7% |
| Immigrants | Brazil | 98.2 /100 | #96 | Exceptional 19.7% |
| Croatians | 98.1 /100 | #97 | Exceptional 19.7% |
| Immigrants | France | 97.9 /100 | #98 | Exceptional 19.7% |
| Sierra Leoneans | 97.9 /100 | #99 | Exceptional 19.7% |
| Ukrainians | 97.6 /100 | #100 | Exceptional 19.8% |
| Immigrants | Belgium | 97.3 /100 | #101 | Exceptional 19.8% |
| Immigrants | Cameroon | 97.3 /100 | #102 | Exceptional 19.8% |
| Immigrants | Southern Europe | 97.1 /100 | #103 | Exceptional 19.9% |
| Chileans | 96.9 /100 | #104 | Exceptional 19.9% |
| Israelis | 96.9 /100 | #105 | Exceptional 19.9% |
| Ethiopians | 96.7 /100 | #106 | Exceptional 19.9% |
| Immigrants | Syria | 96.7 /100 | #107 | Exceptional 19.9% |
| Native Hawaiians | 96.6 /100 | #108 | Exceptional 19.9% |
| Colombians | 96.6 /100 | #109 | Exceptional 19.9% |