Arapaho vs Ethiopian Single Mother Poverty

COMPARE

Arapaho
Race
Ancestry
AfghanAfricanAlaska NativeAlaskan AthabascanAlbanianAleutAlsatianAmericanApacheArabArapahoArgentineanArmenianAssyrian/Chaldean/SyriacAustralianAustrianBahamianBangladeshiBarbadianBasqueBelgianBelizeanBermudanBhutaneseBlackfeetBolivianBrazilianBritishBritish West IndianBulgarianBurmeseCajunCambodianCanadianCape VerdeanCarpatho RusynCelticCentral AmericanCentral American IndianCherokeeCheyenneChickasawChileanChineseChippewaChoctawColombianColvilleComancheCosta RicanCreeCreekCroatianCrowCubanCypriotCzechCzechoslovakianDanishDelawareDominicanDutchDutch West IndianEastern EuropeanEcuadorianEgyptianEnglishEstonianEuropeanFijianFilipinoFinnishFrenchFrench American IndianFrench CanadianGermanGerman RussianGhanaianGreekGuamanian/ChamorroGuatemalanGuyaneseHaitianHmongHonduranHopiHoumaHungarianIcelanderIndian (Asian)IndonesianInupiatIranianIraqiIrishIroquoisIsraeliItalianJamaicanJapaneseJordanianKenyanKiowaKoreanLaotianLatvianLebaneseLiberianLithuanianLumbeeLuxembourgerMacedonianMalaysianMalteseMarshalleseMenomineeMexicanMexican American IndianMongolianMoroccanNative HawaiianNavajoNepaleseNew ZealanderNicaraguanNigerianNorthern EuropeanNorwegianOkinawanOsageOttawaPaiutePakistaniPalestinianPanamanianParaguayanPennsylvania GermanPeruvianPimaPolishPortuguesePotawatomiPuebloPuerto RicanPuget Sound SalishRomanianRussianSalvadoranSamoanScandinavianScotch-IrishScottishSeminoleSenegaleseSerbianShoshoneSierra LeoneanSiouxSlavicSlovakSloveneSomaliSouth AfricanSouth AmericanSouth American IndianSoviet UnionSpaniardSpanishSpanish AmericanSpanish American IndianSri LankanSubsaharan AfricanSudaneseSwedishSwissSyrianTaiwaneseThaiTlingit-HaidaTohono O'OdhamTonganTrinidadian and TobagonianTsimshianTurkishU.S. Virgin IslanderUgandanUkrainianUruguayanUteVenezuelanVietnameseWelshWest IndianYakamaYaquiYugoslavianYumanYup'ikZimbabwean
Immigration
NonimmigrantsImmigrantsAfghanistanAfricaAlbaniaArgentinaArmeniaAsiaAustraliaAustriaBahamasBangladeshBarbadosBelarusBelgiumBelizeBoliviaBosnia and HerzegovinaBrazilBulgariaBurma/MyanmarCabo VerdeCambodiaCameroonCanadaCaribbeanCentral AmericaChileChinaColombiaCongoCosta RicaCroatiaCubaCzechoslovakiaDenmarkDominicaDominican RepublicEastern AfricaEastern AsiaEastern EuropeEcuadorEgyptEl SalvadorEnglandEritreaEthiopiaEuropeFijiFranceGermanyGhanaGreeceGrenadaGuatemalaGuyanaHaitiHondurasHong KongHungaryIndiaIndonesiaIranIraqIrelandIsraelItalyJamaicaJapanJordanKazakhstanKenyaKoreaKuwaitLaosLatin AmericaLatviaLebanonLiberiaLithuaniaMalaysiaMexicoMicronesiaMiddle AfricaMoldovaMoroccoNepalNetherlandsNicaraguaNigeriaNorth AmericaNorth MacedoniaNorthern AfricaNorthern EuropeNorwayOceaniaPakistanPanamaPeruPhilippinesPolandPortugalRomaniaRussiaSaudi ArabiaScotlandSenegalSerbiaSierra LeoneSingaporeSomaliaSouth AfricaSouth AmericaSouth Central AsiaSouth Eastern AsiaSouthern EuropeSpainSri LankaSt. Vincent and the GrenadinesSudanSwedenSwitzerlandSyriaTaiwanThailandTrinidad and TobagoTurkeyUgandaUkraineUruguayUzbekistanVenezuelaVietnamWest IndiesWestern AfricaWestern AsiaWestern EuropeYemenZaireZimbabweAzores
Ethiopian
Race
Ancestry
AfghanAfricanAlaska NativeAlaskan AthabascanAlbanianAleutAlsatianAmericanApacheArabArgentineanArmenianAssyrian/Chaldean/SyriacAustralianAustrianBahamianBangladeshiBarbadianBasqueBelgianBelizeanBermudanBhutaneseBlackfeetBolivianBrazilianBritishBritish West IndianBulgarianBurmeseCajunCambodianCanadianCape VerdeanCarpatho RusynCelticCentral AmericanCentral American IndianCherokeeCheyenneChickasawChileanChineseChippewaChoctawColombianColvilleComancheCosta RicanCreeCreekCroatianCrowCubanCypriotCzechCzechoslovakianDanishDelawareDominicanDutchDutch West IndianEastern EuropeanEcuadorianEgyptianEnglishEstonianEthiopianEuropeanFijianFilipinoFinnishFrenchFrench American IndianFrench CanadianGermanGerman RussianGhanaianGreekGuamanian/ChamorroGuatemalanGuyaneseHaitianHmongHonduranHopiHoumaHungarianIcelanderIndian (Asian)IndonesianInupiatIranianIraqiIrishIroquoisIsraeliItalianJamaicanJapaneseJordanianKenyanKiowaKoreanLaotianLatvianLebaneseLiberianLithuanianLumbeeLuxembourgerMacedonianMalaysianMalteseMarshalleseMenomineeMexicanMexican American IndianMongolianMoroccanNative HawaiianNavajoNepaleseNew ZealanderNicaraguanNigerianNorthern EuropeanNorwegianOkinawanOsageOttawaPaiutePakistaniPalestinianPanamanianParaguayanPennsylvania GermanPeruvianPimaPolishPortuguesePotawatomiPuebloPuerto RicanPuget Sound SalishRomanianRussianSalvadoranSamoanScandinavianScotch-IrishScottishSeminoleSenegaleseSerbianShoshoneSierra LeoneanSiouxSlavicSlovakSloveneSomaliSouth AfricanSouth AmericanSouth American IndianSoviet UnionSpaniardSpanishSpanish AmericanSpanish American IndianSri LankanSubsaharan AfricanSudaneseSwedishSwissSyrianTaiwaneseThaiTlingit-HaidaTohono O'OdhamTonganTrinidadian and TobagonianTsimshianTurkishU.S. Virgin IslanderUgandanUkrainianUruguayanUteVenezuelanVietnameseWelshWest IndianYakamaYaquiYugoslavianYumanYup'ikZimbabwean
Immigration
NonimmigrantsImmigrantsAfghanistanAfricaAlbaniaArgentinaArmeniaAsiaAustraliaAustriaBahamasBangladeshBarbadosBelarusBelgiumBelizeBoliviaBosnia and HerzegovinaBrazilBulgariaBurma/MyanmarCabo VerdeCambodiaCameroonCanadaCaribbeanCentral AmericaChileChinaColombiaCongoCosta RicaCroatiaCubaCzechoslovakiaDenmarkDominicaDominican RepublicEastern AfricaEastern AsiaEastern EuropeEcuadorEgyptEl SalvadorEnglandEritreaEthiopiaEuropeFijiFranceGermanyGhanaGreeceGrenadaGuatemalaGuyanaHaitiHondurasHong KongHungaryIndiaIndonesiaIranIraqIrelandIsraelItalyJamaicaJapanJordanKazakhstanKenyaKoreaKuwaitLaosLatin AmericaLatviaLebanonLiberiaLithuaniaMalaysiaMexicoMicronesiaMiddle AfricaMoldovaMoroccoNepalNetherlandsNicaraguaNigeriaNorth AmericaNorth MacedoniaNorthern AfricaNorthern EuropeNorwayOceaniaPakistanPanamaPeruPhilippinesPolandPortugalRomaniaRussiaSaudi ArabiaScotlandSenegalSerbiaSierra LeoneSingaporeSomaliaSouth AfricaSouth AmericaSouth Central AsiaSouth Eastern AsiaSouthern EuropeSpainSri LankaSt. Vincent and the GrenadinesSudanSwedenSwitzerlandSyriaTaiwanThailandTrinidad and TobagoTurkeyUgandaUkraineUruguayUzbekistanVenezuelaVietnamWest IndiesWestern AfricaWestern AsiaWestern EuropeYemenZaireZimbabweAzores
Single Mother Poverty
Income
Poverty
Unemployment
Labor Participation
Family Structure
Vehicle Availability
Education Level
Disability

Single Mother Poverty Comparison

Arapaho

Ethiopians

Tragic
Exceptional
33.4%
SINGLE MOTHER POVERTY
0.0/ 100
METRIC RATING
302nd/ 347
METRIC RANK
27.7%
SINGLE MOTHER POVERTY
98.4/ 100
METRIC RATING
88th/ 347
METRIC RANK

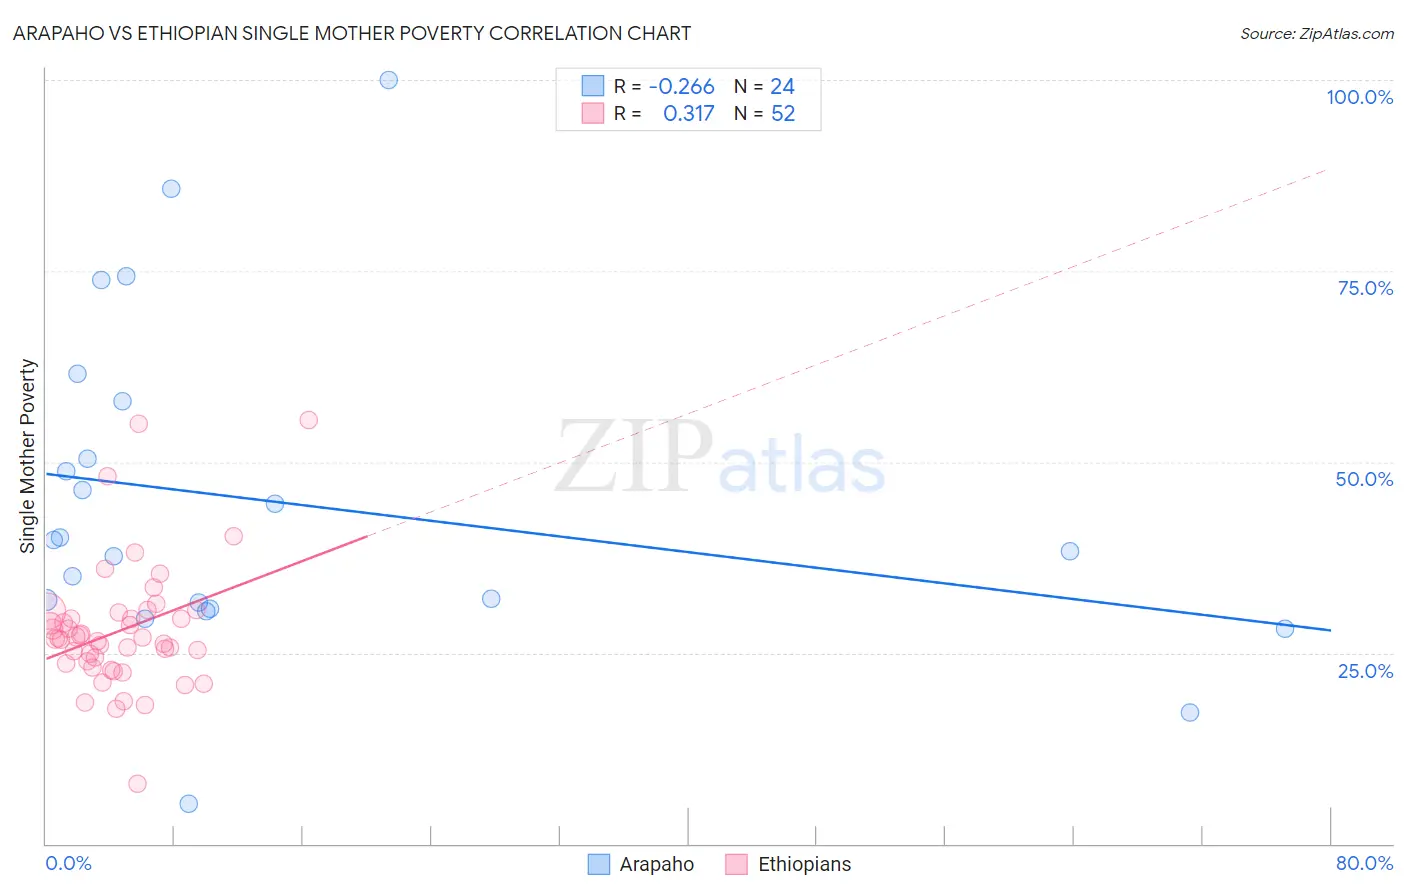
Arapaho vs Ethiopian Single Mother Poverty Correlation Chart

The statistical analysis conducted on geographies consisting of 29,572,302 people shows a weak negative correlation between the proportion of Arapaho and poverty level among single mothers in the United States with a correlation coefficient (R) of -0.266 and weighted average of 33.4%. Similarly, the statistical analysis conducted on geographies consisting of 220,975,245 people shows a mild positive correlation between the proportion of Ethiopians and poverty level among single mothers in the United States with a correlation coefficient (R) of 0.317 and weighted average of 27.7%, a difference of 20.6%.
Arapaho vs Ethiopian Single Mother Poverty

Single Mother Poverty Correlation Summary

MeasurementArapahoEthiopian
Minimum5.3%7.9%
Maximum100.0%55.4%
Range94.7%47.5%
Mean44.6%27.9%
Median39.0%26.9%
Interquartile 25% (IQ1)31.2%23.7%
Interquartile 75% (IQ3)54.1%29.9%
Interquartile Range (IQR)22.9%6.1%
Standard Deviation (Sample)21.8%8.3%
Standard Deviation (Population)21.3%8.2%

Similar Demographics by Single Mother Poverty

Demographics Similar to Arapaho by Single Mother Poverty

In terms of single mother poverty, the demographic groups most similar to Arapaho are Immigrants from Somalia (33.4%, a difference of 0.15%), American (33.5%, a difference of 0.26%), Mexican (33.6%, a difference of 0.37%), Immigrants from Guatemala (33.3%, a difference of 0.39%), and Hispanic or Latino (33.3%, a difference of 0.39%).
DemographicsRating | RankSingle Mother Poverty
Yaqui
0.0
/100
|
#295
Tragic
33.1%
Blackfeet
0.0
/100
|
#296
Tragic
33.2%
Pennsylvania Germans
0.0
/100
|
#297
Tragic
33.2%
Africans
0.0
/100
|
#298
Tragic
33.3%
Immigrants | Guatemala
0.0
/100
|
#299
Tragic
33.3%
Hispanics or Latinos
0.0
/100
|
#300
Tragic
33.3%
Immigrants | Somalia
0.0
/100
|
#301
Tragic
33.4%
Arapaho
0.0
/100
|
#302
Tragic
33.4%
Americans
0.0
/100
|
#303
Tragic
33.5%
Mexicans
0.0
/100
|
#304
Tragic
33.6%
Immigrants | Central America
0.0
/100
|
#305
Tragic
33.6%
Immigrants | Congo
0.0
/100
|
#306
Tragic
33.8%
Comanche
0.0
/100
|
#307
Tragic
33.9%
Immigrants | Mexico
0.0
/100
|
#308
Tragic
34.0%
Potawatomi
0.0
/100
|
#309
Tragic
34.1%

Demographics Similar to Ethiopians by Single Mother Poverty

In terms of single mother poverty, the demographic groups most similar to Ethiopians are Afghan (27.7%, a difference of 0.020%), Immigrants from Ethiopia (27.7%, a difference of 0.020%), Immigrants from Ukraine (27.7%, a difference of 0.12%), Immigrants from France (27.8%, a difference of 0.19%), and Mongolian (27.7%, a difference of 0.21%).
DemographicsRating | RankSingle Mother Poverty
Immigrants | Scotland
98.9
/100
|
#81
Exceptional
27.6%
Immigrants | Cameroon
98.8
/100
|
#82
Exceptional
27.6%
Greeks
98.7
/100
|
#83
Exceptional
27.7%
Immigrants | Latvia
98.7
/100
|
#84
Exceptional
27.7%
Mongolians
98.7
/100
|
#85
Exceptional
27.7%
Immigrants | Ukraine
98.6
/100
|
#86
Exceptional
27.7%
Afghans
98.5
/100
|
#87
Exceptional
27.7%
Ethiopians
98.4
/100
|
#88
Exceptional
27.7%
Immigrants | Ethiopia
98.4
/100
|
#89
Exceptional
27.7%
Immigrants | France
98.2
/100
|
#90
Exceptional
27.8%
Immigrants | Albania
98.0
/100
|
#91
Exceptional
27.8%
Estonians
97.9
/100
|
#92
Exceptional
27.8%
Romanians
97.8
/100
|
#93
Exceptional
27.8%
Albanians
97.6
/100
|
#94
Exceptional
27.9%
Chileans
97.5
/100
|
#95
Exceptional
27.9%