Arapaho vs Egyptian Single Mother Poverty
COMPARE
Arapaho
Egyptian
Single Mother Poverty
Single Mother Poverty Comparison
Arapaho
Egyptians
33.4%
SINGLE MOTHER POVERTY
0.0/ 100
METRIC RATING
302nd/ 347
METRIC RANK
26.9%
SINGLE MOTHER POVERTY
99.8/ 100
METRIC RATING
47th/ 347
METRIC RANK
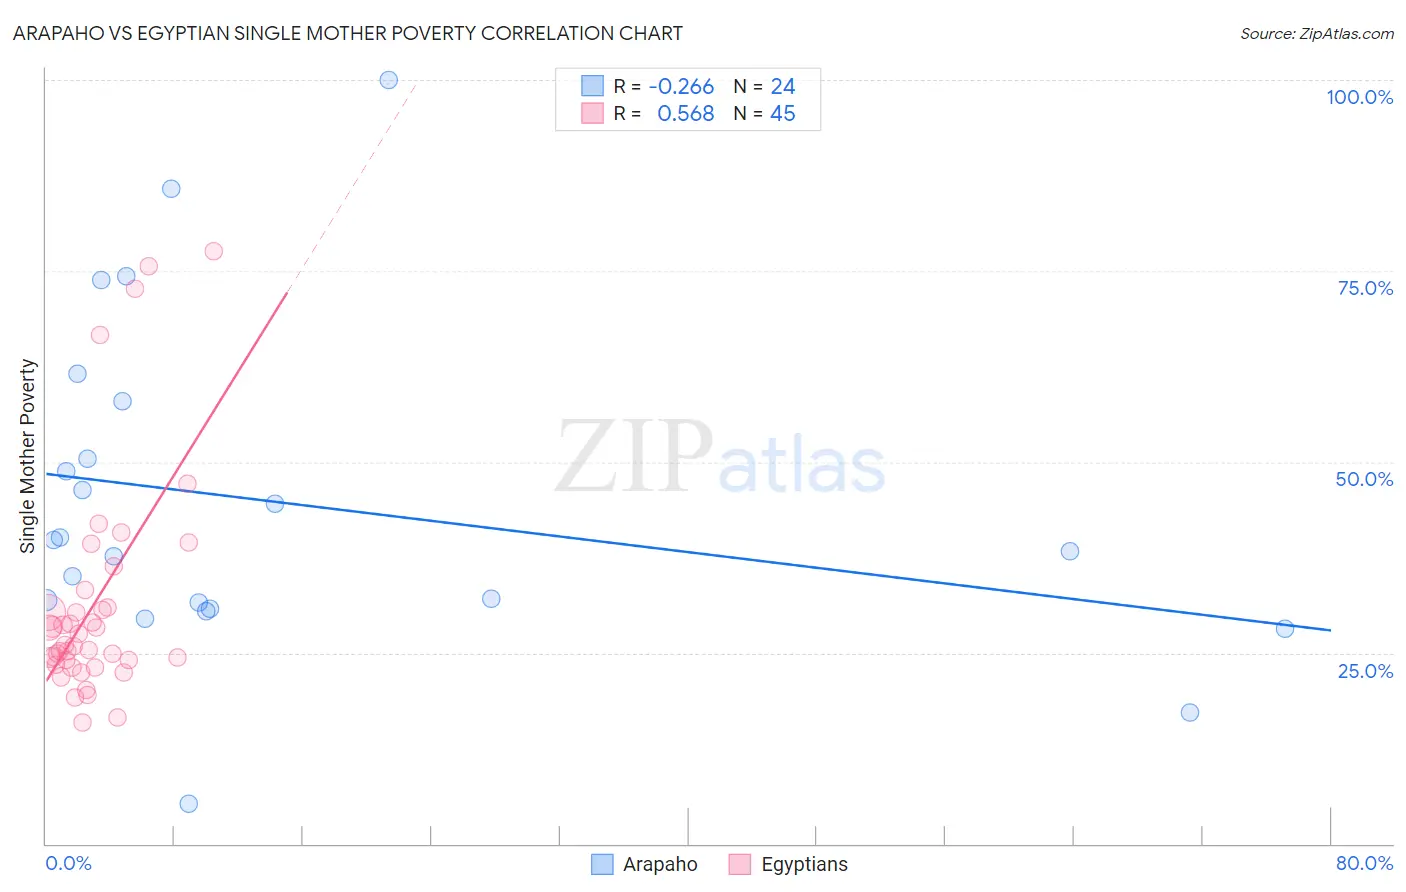
Arapaho vs Egyptian Single Mother Poverty Correlation Chart
The statistical analysis conducted on geographies consisting of 29,572,302 people shows a weak negative correlation between the proportion of Arapaho and poverty level among single mothers in the United States with a correlation coefficient (R) of -0.266 and weighted average of 33.4%. Similarly, the statistical analysis conducted on geographies consisting of 271,623,906 people shows a substantial positive correlation between the proportion of Egyptians and poverty level among single mothers in the United States with a correlation coefficient (R) of 0.568 and weighted average of 26.9%, a difference of 24.2%.
Single Mother Poverty Correlation Summary
| Measurement | Arapaho | Egyptian |
| Minimum | 5.3% | 15.9% |
| Maximum | 100.0% | 77.6% |
| Range | 94.7% | 61.7% |
| Mean | 44.6% | 31.5% |
| Median | 39.0% | 26.1% |
| Interquartile 25% (IQ1) | 31.2% | 23.8% |
| Interquartile 75% (IQ3) | 54.1% | 32.1% |
| Interquartile Range (IQR) | 22.9% | 8.3% |
| Standard Deviation (Sample) | 21.8% | 14.7% |
| Standard Deviation (Population) | 21.3% | 14.6% |
Similar Demographics by Single Mother Poverty
Demographics Similar to Arapaho by Single Mother Poverty
In terms of single mother poverty, the demographic groups most similar to Arapaho are Immigrants from Somalia (33.4%, a difference of 0.15%), American (33.5%, a difference of 0.26%), Mexican (33.6%, a difference of 0.37%), Immigrants from Guatemala (33.3%, a difference of 0.39%), and Hispanic or Latino (33.3%, a difference of 0.39%).
| Demographics | Rating | Rank | Single Mother Poverty |
| Yaqui | 0.0 /100 | #295 | Tragic 33.1% |
| Blackfeet | 0.0 /100 | #296 | Tragic 33.2% |
| Pennsylvania Germans | 0.0 /100 | #297 | Tragic 33.2% |
| Africans | 0.0 /100 | #298 | Tragic 33.3% |
| Immigrants | Guatemala | 0.0 /100 | #299 | Tragic 33.3% |
| Hispanics or Latinos | 0.0 /100 | #300 | Tragic 33.3% |
| Immigrants | Somalia | 0.0 /100 | #301 | Tragic 33.4% |
| Arapaho | 0.0 /100 | #302 | Tragic 33.4% |
| Americans | 0.0 /100 | #303 | Tragic 33.5% |
| Mexicans | 0.0 /100 | #304 | Tragic 33.6% |
| Immigrants | Central America | 0.0 /100 | #305 | Tragic 33.6% |
| Immigrants | Congo | 0.0 /100 | #306 | Tragic 33.8% |
| Comanche | 0.0 /100 | #307 | Tragic 33.9% |
| Immigrants | Mexico | 0.0 /100 | #308 | Tragic 34.0% |
| Potawatomi | 0.0 /100 | #309 | Tragic 34.1% |
Demographics Similar to Egyptians by Single Mother Poverty
In terms of single mother poverty, the demographic groups most similar to Egyptians are Immigrants from Serbia (26.9%, a difference of 0.060%), Immigrants from Poland (26.9%, a difference of 0.080%), Latvian (26.9%, a difference of 0.10%), Cambodian (27.0%, a difference of 0.16%), and Laotian (27.0%, a difference of 0.17%).
| Demographics | Rating | Rank | Single Mother Poverty |
| Immigrants | Vietnam | 99.9 /100 | #40 | Exceptional 26.7% |
| Immigrants | Greece | 99.9 /100 | #41 | Exceptional 26.7% |
| Armenians | 99.9 /100 | #42 | Exceptional 26.8% |
| Tsimshian | 99.9 /100 | #43 | Exceptional 26.8% |
| Immigrants | Sierra Leone | 99.9 /100 | #44 | Exceptional 26.9% |
| Latvians | 99.9 /100 | #45 | Exceptional 26.9% |
| Immigrants | Serbia | 99.9 /100 | #46 | Exceptional 26.9% |
| Egyptians | 99.8 /100 | #47 | Exceptional 26.9% |
| Immigrants | Poland | 99.8 /100 | #48 | Exceptional 26.9% |
| Cambodians | 99.8 /100 | #49 | Exceptional 27.0% |
| Laotians | 99.8 /100 | #50 | Exceptional 27.0% |
| Immigrants | Argentina | 99.7 /100 | #51 | Exceptional 27.1% |
| Immigrants | South Eastern Asia | 99.7 /100 | #52 | Exceptional 27.1% |
| Immigrants | Jordan | 99.7 /100 | #53 | Exceptional 27.1% |
| Immigrants | Bulgaria | 99.7 /100 | #54 | Exceptional 27.1% |