Irish vs Ethiopian Single Mother Poverty
COMPARE
Irish
Ethiopian
Single Mother Poverty
Single Mother Poverty Comparison
Irish
Ethiopians
29.8%
SINGLE MOTHER POVERTY
13.9/ 100
METRIC RATING
209th/ 347
METRIC RANK
27.7%
SINGLE MOTHER POVERTY
98.4/ 100
METRIC RATING
88th/ 347
METRIC RANK
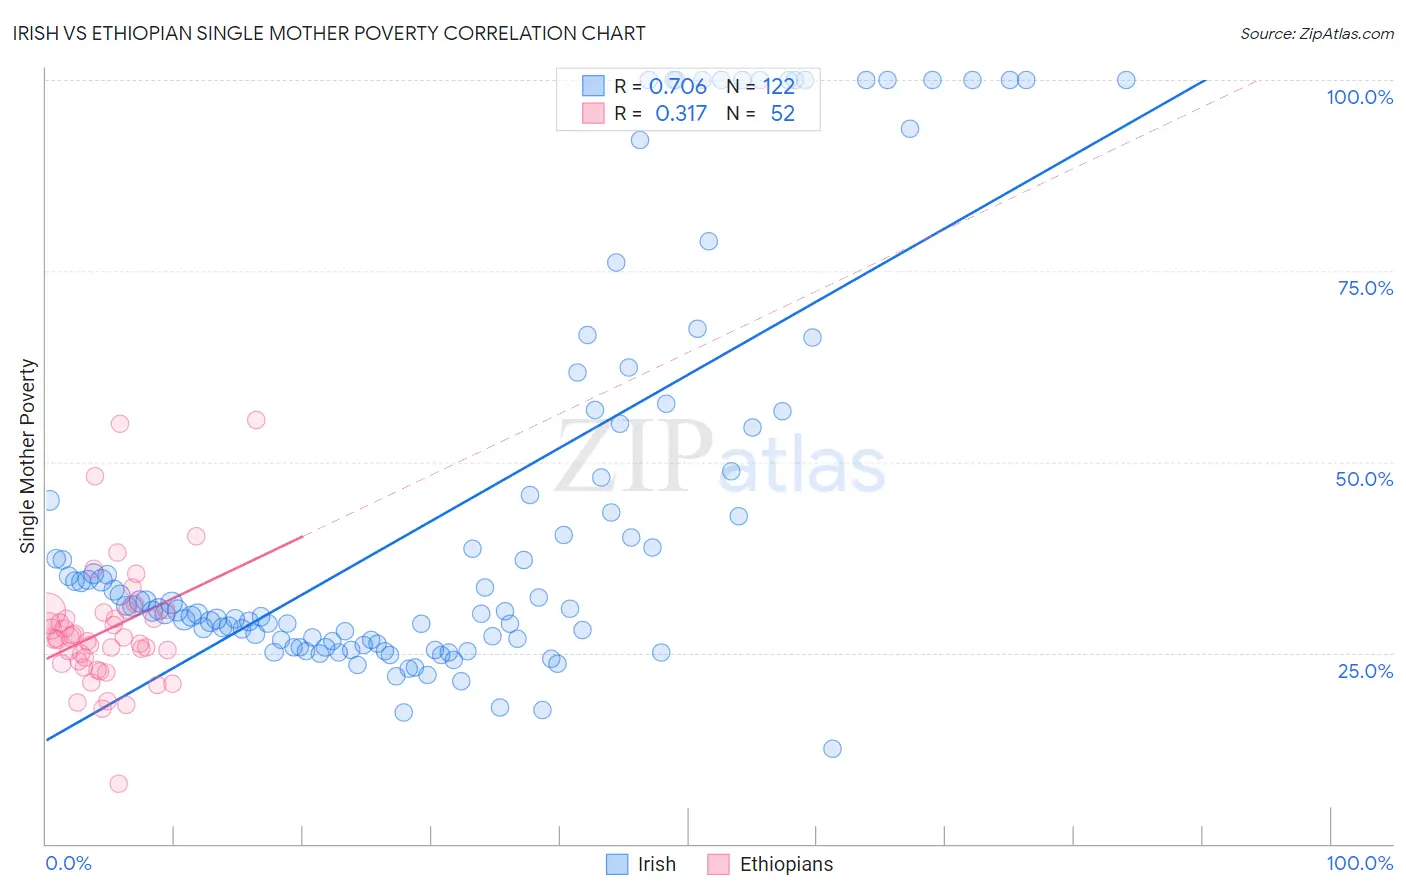
Irish vs Ethiopian Single Mother Poverty Correlation Chart
The statistical analysis conducted on geographies consisting of 549,467,184 people shows a strong positive correlation between the proportion of Irish and poverty level among single mothers in the United States with a correlation coefficient (R) of 0.706 and weighted average of 29.8%. Similarly, the statistical analysis conducted on geographies consisting of 220,975,245 people shows a mild positive correlation between the proportion of Ethiopians and poverty level among single mothers in the United States with a correlation coefficient (R) of 0.317 and weighted average of 27.7%, a difference of 7.5%.
Single Mother Poverty Correlation Summary
| Measurement | Irish | Ethiopian |
| Minimum | 12.4% | 7.9% |
| Maximum | 100.0% | 55.4% |
| Range | 87.6% | 47.5% |
| Mean | 43.8% | 27.9% |
| Median | 30.8% | 26.9% |
| Interquartile 25% (IQ1) | 26.6% | 23.7% |
| Interquartile 75% (IQ3) | 54.5% | 29.9% |
| Interquartile Range (IQR) | 28.0% | 6.1% |
| Standard Deviation (Sample) | 26.6% | 8.3% |
| Standard Deviation (Population) | 26.5% | 8.2% |
Similar Demographics by Single Mother Poverty
Demographics Similar to Irish by Single Mother Poverty
In terms of single mother poverty, the demographic groups most similar to Irish are Haitian (29.8%, a difference of 0.060%), Immigrants from Guyana (29.8%, a difference of 0.080%), Guyanese (29.8%, a difference of 0.11%), Immigrants from Panama (29.8%, a difference of 0.15%), and Nicaraguan (29.8%, a difference of 0.15%).
| Demographics | Rating | Rank | Single Mother Poverty |
| Malaysians | 17.4 /100 | #202 | Poor 29.7% |
| Swiss | 17.2 /100 | #203 | Poor 29.7% |
| Immigrants | Immigrants | 16.6 /100 | #204 | Poor 29.7% |
| Czechoslovakians | 16.1 /100 | #205 | Poor 29.7% |
| Immigrants | Haiti | 15.8 /100 | #206 | Poor 29.7% |
| Immigrants | Panama | 15.5 /100 | #207 | Poor 29.8% |
| Immigrants | Guyana | 14.7 /100 | #208 | Poor 29.8% |
| Irish | 13.9 /100 | #209 | Poor 29.8% |
| Haitians | 13.3 /100 | #210 | Poor 29.8% |
| Guyanese | 12.8 /100 | #211 | Poor 29.8% |
| Nicaraguans | 12.4 /100 | #212 | Poor 29.8% |
| Immigrants | Thailand | 12.0 /100 | #213 | Poor 29.9% |
| Liberians | 11.7 /100 | #214 | Poor 29.9% |
| Jamaicans | 11.7 /100 | #215 | Poor 29.9% |
| Immigrants | Western Africa | 11.5 /100 | #216 | Poor 29.9% |
Demographics Similar to Ethiopians by Single Mother Poverty
In terms of single mother poverty, the demographic groups most similar to Ethiopians are Afghan (27.7%, a difference of 0.020%), Immigrants from Ethiopia (27.7%, a difference of 0.020%), Immigrants from Ukraine (27.7%, a difference of 0.12%), Immigrants from France (27.8%, a difference of 0.19%), and Mongolian (27.7%, a difference of 0.21%).
| Demographics | Rating | Rank | Single Mother Poverty |
| Immigrants | Scotland | 98.9 /100 | #81 | Exceptional 27.6% |
| Immigrants | Cameroon | 98.8 /100 | #82 | Exceptional 27.6% |
| Greeks | 98.7 /100 | #83 | Exceptional 27.7% |
| Immigrants | Latvia | 98.7 /100 | #84 | Exceptional 27.7% |
| Mongolians | 98.7 /100 | #85 | Exceptional 27.7% |
| Immigrants | Ukraine | 98.6 /100 | #86 | Exceptional 27.7% |
| Afghans | 98.5 /100 | #87 | Exceptional 27.7% |
| Ethiopians | 98.4 /100 | #88 | Exceptional 27.7% |
| Immigrants | Ethiopia | 98.4 /100 | #89 | Exceptional 27.7% |
| Immigrants | France | 98.2 /100 | #90 | Exceptional 27.8% |
| Immigrants | Albania | 98.0 /100 | #91 | Exceptional 27.8% |
| Estonians | 97.9 /100 | #92 | Exceptional 27.8% |
| Romanians | 97.8 /100 | #93 | Exceptional 27.8% |
| Albanians | 97.6 /100 | #94 | Exceptional 27.9% |
| Chileans | 97.5 /100 | #95 | Exceptional 27.9% |