Arapaho vs Immigrants from the Azores Single Mother Poverty
COMPARE
Arapaho
Immigrants from the Azores
Single Mother Poverty
Single Mother Poverty Comparison
Arapaho
Immigrants from the Azores
33.4%
SINGLE MOTHER POVERTY
0.0/ 100
METRIC RATING
302nd/ 347
METRIC RANK
32.2%
SINGLE MOTHER POVERTY
0.0/ 100
METRIC RATING
282nd/ 347
METRIC RANK
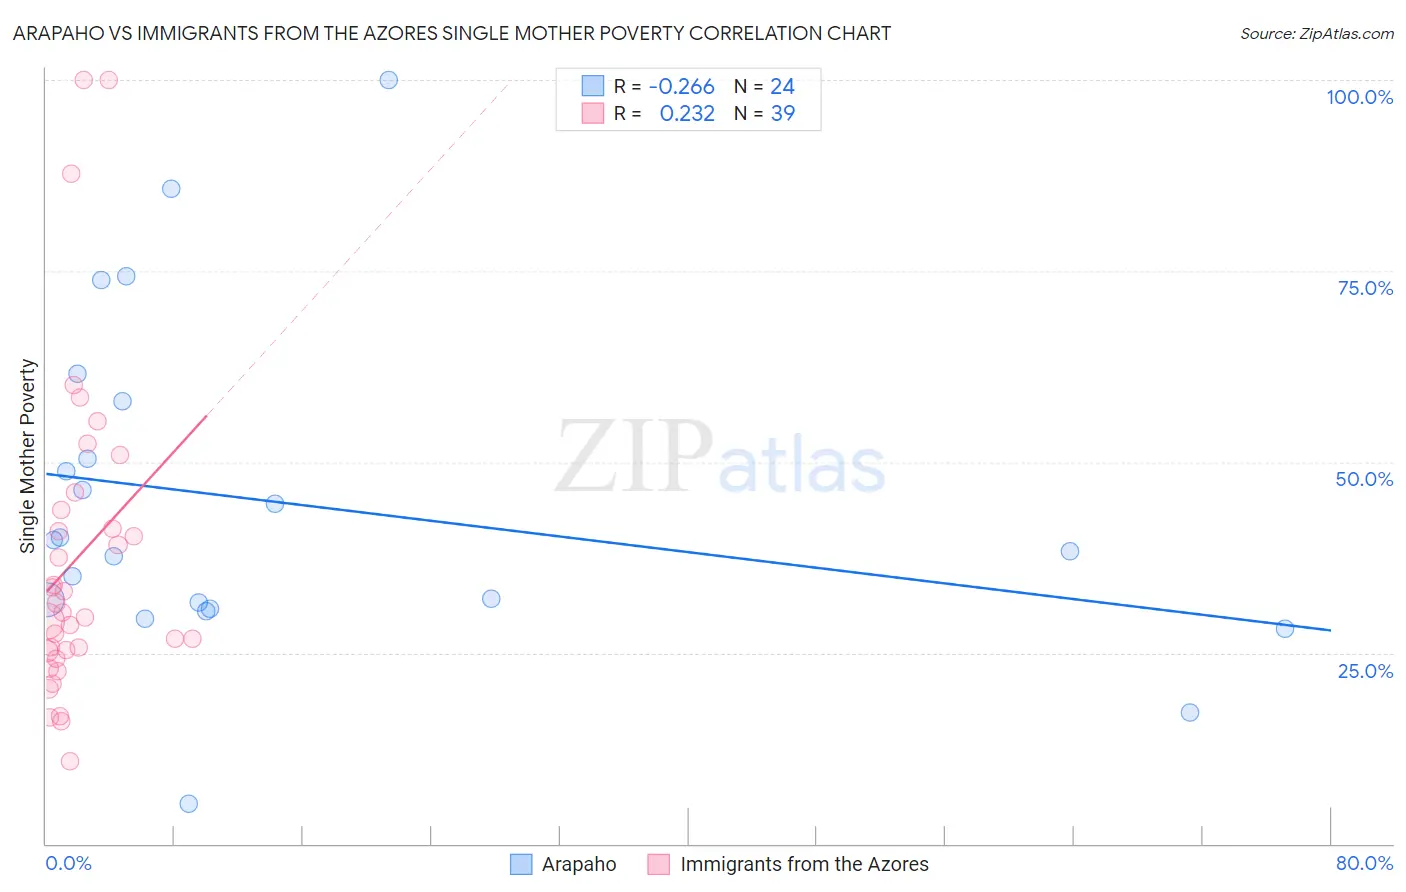
Arapaho vs Immigrants from the Azores Single Mother Poverty Correlation Chart
The statistical analysis conducted on geographies consisting of 29,572,302 people shows a weak negative correlation between the proportion of Arapaho and poverty level among single mothers in the United States with a correlation coefficient (R) of -0.266 and weighted average of 33.4%. Similarly, the statistical analysis conducted on geographies consisting of 45,777,627 people shows a weak positive correlation between the proportion of Immigrants from the Azores and poverty level among single mothers in the United States with a correlation coefficient (R) of 0.232 and weighted average of 32.2%, a difference of 3.8%.
Single Mother Poverty Correlation Summary
| Measurement | Arapaho | Immigrants from the Azores |
| Minimum | 5.3% | 10.8% |
| Maximum | 100.0% | 100.0% |
| Range | 94.7% | 89.2% |
| Mean | 44.6% | 37.4% |
| Median | 39.0% | 30.3% |
| Interquartile 25% (IQ1) | 31.2% | 25.3% |
| Interquartile 75% (IQ3) | 54.1% | 43.7% |
| Interquartile Range (IQR) | 22.9% | 18.5% |
| Standard Deviation (Sample) | 21.8% | 20.9% |
| Standard Deviation (Population) | 21.3% | 20.6% |
Demographics Similar to Arapaho and Immigrants from the Azores by Single Mother Poverty
In terms of single mother poverty, the demographic groups most similar to Arapaho are Immigrants from Somalia (33.4%, a difference of 0.15%), Immigrants from Guatemala (33.3%, a difference of 0.39%), Hispanic or Latino (33.3%, a difference of 0.39%), African (33.3%, a difference of 0.48%), and Pennsylvania German (33.2%, a difference of 0.59%). Similarly, the demographic groups most similar to Immigrants from the Azores are Spanish American (32.3%, a difference of 0.25%), Indonesian (32.4%, a difference of 0.55%), Immigrants from Latin America (32.4%, a difference of 0.66%), Yup'ik (32.5%, a difference of 0.73%), and Immigrants from Dominica (32.5%, a difference of 0.86%).
| Demographics | Rating | Rank | Single Mother Poverty |
| Immigrants | Azores | 0.0 /100 | #282 | Tragic 32.2% |
| Spanish Americans | 0.0 /100 | #283 | Tragic 32.3% |
| Indonesians | 0.0 /100 | #284 | Tragic 32.4% |
| Immigrants | Latin America | 0.0 /100 | #285 | Tragic 32.4% |
| Yup'ik | 0.0 /100 | #286 | Tragic 32.5% |
| Immigrants | Dominica | 0.0 /100 | #287 | Tragic 32.5% |
| Somalis | 0.0 /100 | #288 | Tragic 32.6% |
| U.S. Virgin Islanders | 0.0 /100 | #289 | Tragic 32.6% |
| Osage | 0.0 /100 | #290 | Tragic 32.6% |
| Guatemalans | 0.0 /100 | #291 | Tragic 32.9% |
| Shoshone | 0.0 /100 | #292 | Tragic 32.9% |
| Aleuts | 0.0 /100 | #293 | Tragic 32.9% |
| French American Indians | 0.0 /100 | #294 | Tragic 33.1% |
| Yaqui | 0.0 /100 | #295 | Tragic 33.1% |
| Blackfeet | 0.0 /100 | #296 | Tragic 33.2% |
| Pennsylvania Germans | 0.0 /100 | #297 | Tragic 33.2% |
| Africans | 0.0 /100 | #298 | Tragic 33.3% |
| Immigrants | Guatemala | 0.0 /100 | #299 | Tragic 33.3% |
| Hispanics or Latinos | 0.0 /100 | #300 | Tragic 33.3% |
| Immigrants | Somalia | 0.0 /100 | #301 | Tragic 33.4% |
| Arapaho | 0.0 /100 | #302 | Tragic 33.4% |