Arapaho vs Icelander Single Mother Poverty
COMPARE
Arapaho
Icelander
Single Mother Poverty
Single Mother Poverty Comparison
Arapaho
Icelanders
33.4%
SINGLE MOTHER POVERTY
0.0/ 100
METRIC RATING
302nd/ 347
METRIC RANK
29.5%
SINGLE MOTHER POVERTY
26.1/ 100
METRIC RATING
194th/ 347
METRIC RANK
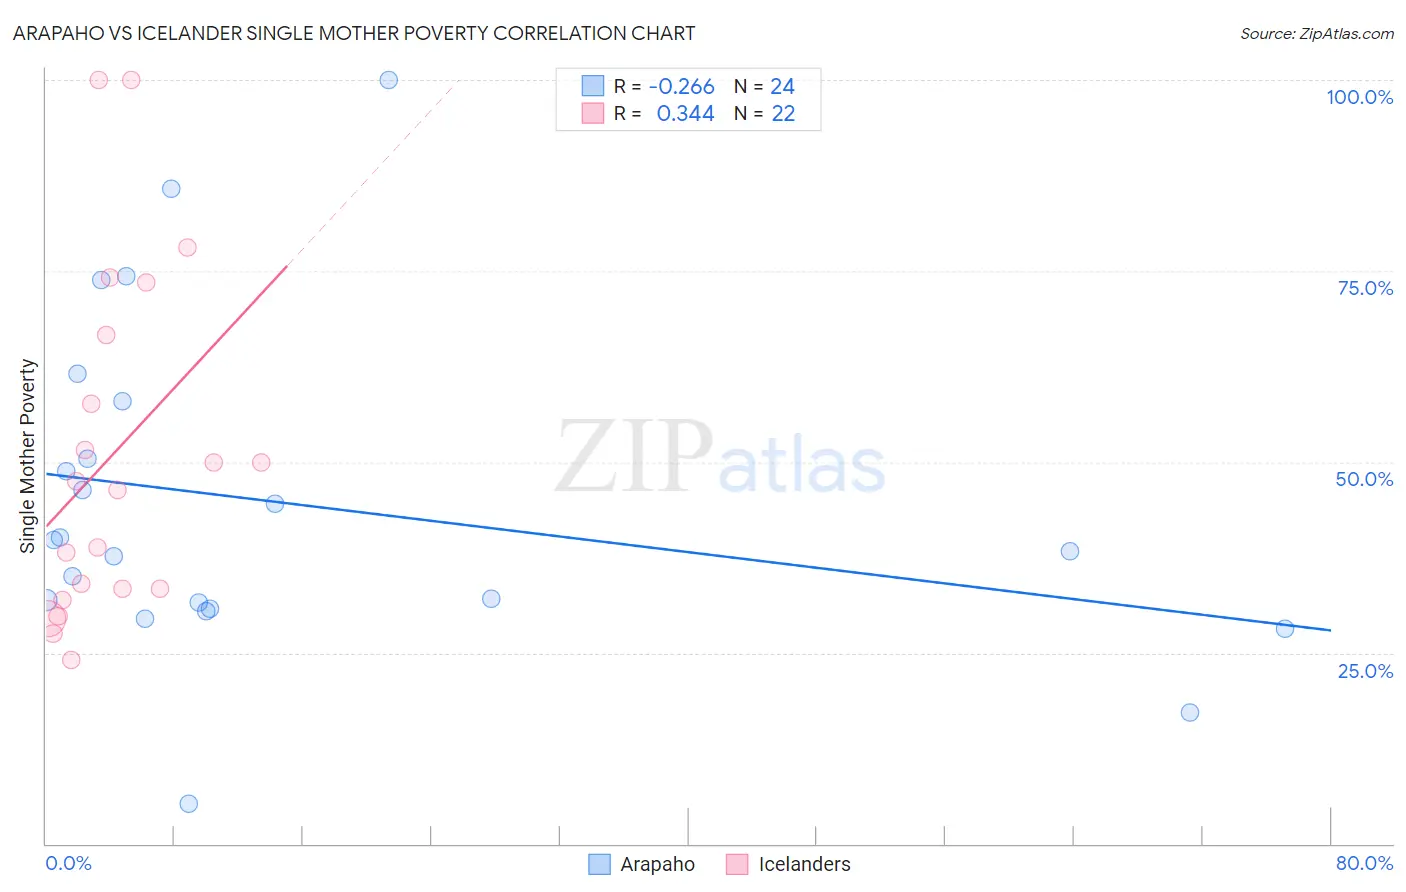
Arapaho vs Icelander Single Mother Poverty Correlation Chart
The statistical analysis conducted on geographies consisting of 29,572,302 people shows a weak negative correlation between the proportion of Arapaho and poverty level among single mothers in the United States with a correlation coefficient (R) of -0.266 and weighted average of 33.4%. Similarly, the statistical analysis conducted on geographies consisting of 157,541,797 people shows a mild positive correlation between the proportion of Icelanders and poverty level among single mothers in the United States with a correlation coefficient (R) of 0.344 and weighted average of 29.5%, a difference of 13.2%.
Single Mother Poverty Correlation Summary
| Measurement | Arapaho | Icelander |
| Minimum | 5.3% | 24.1% |
| Maximum | 100.0% | 100.0% |
| Range | 94.7% | 75.9% |
| Mean | 44.6% | 50.7% |
| Median | 39.0% | 46.9% |
| Interquartile 25% (IQ1) | 31.2% | 33.3% |
| Interquartile 75% (IQ3) | 54.1% | 66.7% |
| Interquartile Range (IQR) | 22.9% | 33.3% |
| Standard Deviation (Sample) | 21.8% | 22.6% |
| Standard Deviation (Population) | 21.3% | 22.0% |
Similar Demographics by Single Mother Poverty
Demographics Similar to Arapaho by Single Mother Poverty
In terms of single mother poverty, the demographic groups most similar to Arapaho are Immigrants from Somalia (33.4%, a difference of 0.15%), American (33.5%, a difference of 0.26%), Mexican (33.6%, a difference of 0.37%), Immigrants from Guatemala (33.3%, a difference of 0.39%), and Hispanic or Latino (33.3%, a difference of 0.39%).
| Demographics | Rating | Rank | Single Mother Poverty |
| Yaqui | 0.0 /100 | #295 | Tragic 33.1% |
| Blackfeet | 0.0 /100 | #296 | Tragic 33.2% |
| Pennsylvania Germans | 0.0 /100 | #297 | Tragic 33.2% |
| Africans | 0.0 /100 | #298 | Tragic 33.3% |
| Immigrants | Guatemala | 0.0 /100 | #299 | Tragic 33.3% |
| Hispanics or Latinos | 0.0 /100 | #300 | Tragic 33.3% |
| Immigrants | Somalia | 0.0 /100 | #301 | Tragic 33.4% |
| Arapaho | 0.0 /100 | #302 | Tragic 33.4% |
| Americans | 0.0 /100 | #303 | Tragic 33.5% |
| Mexicans | 0.0 /100 | #304 | Tragic 33.6% |
| Immigrants | Central America | 0.0 /100 | #305 | Tragic 33.6% |
| Immigrants | Congo | 0.0 /100 | #306 | Tragic 33.8% |
| Comanche | 0.0 /100 | #307 | Tragic 33.9% |
| Immigrants | Mexico | 0.0 /100 | #308 | Tragic 34.0% |
| Potawatomi | 0.0 /100 | #309 | Tragic 34.1% |
Demographics Similar to Icelanders by Single Mother Poverty
In terms of single mother poverty, the demographic groups most similar to Icelanders are Slavic (29.6%, a difference of 0.10%), Basque (29.5%, a difference of 0.13%), Moroccan (29.5%, a difference of 0.15%), Spanish American Indian (29.6%, a difference of 0.17%), and Immigrants from Trinidad and Tobago (29.5%, a difference of 0.19%).
| Demographics | Rating | Rank | Single Mother Poverty |
| Lebanese | 32.5 /100 | #187 | Fair 29.4% |
| Guamanians/Chamorros | 31.8 /100 | #188 | Fair 29.4% |
| Immigrants | Africa | 31.6 /100 | #189 | Fair 29.4% |
| Immigrants | Germany | 30.4 /100 | #190 | Fair 29.5% |
| Immigrants | Trinidad and Tobago | 29.2 /100 | #191 | Fair 29.5% |
| Moroccans | 28.6 /100 | #192 | Fair 29.5% |
| Basques | 28.3 /100 | #193 | Fair 29.5% |
| Icelanders | 26.1 /100 | #194 | Fair 29.5% |
| Slavs | 24.5 /100 | #195 | Fair 29.6% |
| Spanish American Indians | 23.4 /100 | #196 | Fair 29.6% |
| Immigrants | Jamaica | 22.0 /100 | #197 | Fair 29.6% |
| Trinidadians and Tobagonians | 21.7 /100 | #198 | Fair 29.6% |
| Cubans | 20.8 /100 | #199 | Fair 29.6% |
| Panamanians | 20.0 /100 | #200 | Fair 29.6% |
| Belgians | 18.8 /100 | #201 | Poor 29.7% |