Marshallese vs Ethiopian Single Mother Poverty
COMPARE
Marshallese
Ethiopian
Single Mother Poverty
Single Mother Poverty Comparison
Marshallese
Ethiopians
32.1%
SINGLE MOTHER POVERTY
0.0/ 100
METRIC RATING
279th/ 347
METRIC RANK
27.7%
SINGLE MOTHER POVERTY
98.4/ 100
METRIC RATING
88th/ 347
METRIC RANK
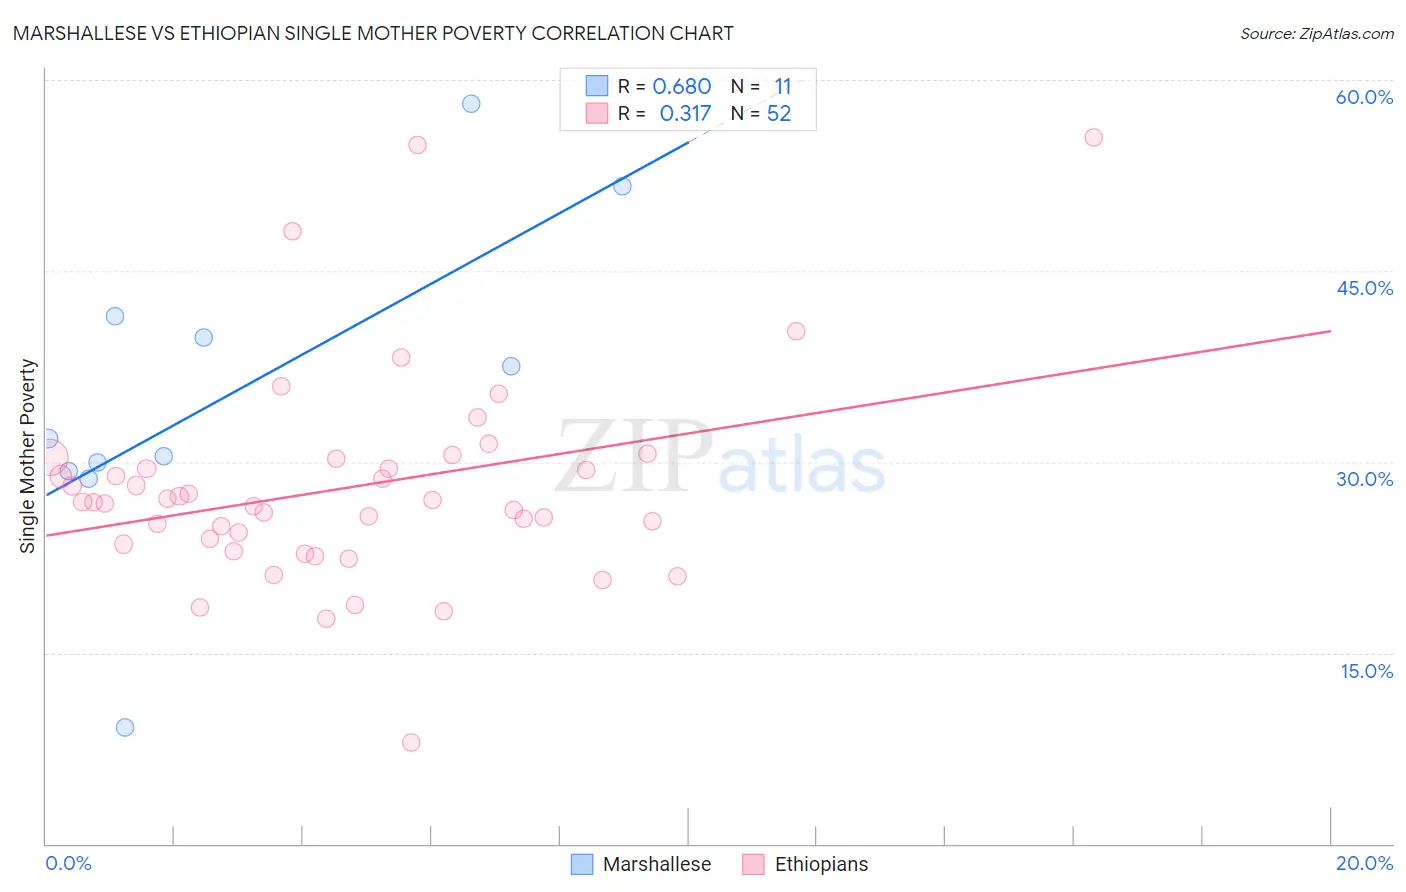
Marshallese vs Ethiopian Single Mother Poverty Correlation Chart
The statistical analysis conducted on geographies consisting of 14,718,372 people shows a significant positive correlation between the proportion of Marshallese and poverty level among single mothers in the United States with a correlation coefficient (R) of 0.680 and weighted average of 32.1%. Similarly, the statistical analysis conducted on geographies consisting of 220,975,245 people shows a mild positive correlation between the proportion of Ethiopians and poverty level among single mothers in the United States with a correlation coefficient (R) of 0.317 and weighted average of 27.7%, a difference of 15.8%.
Single Mother Poverty Correlation Summary
| Measurement | Marshallese | Ethiopian |
| Minimum | 9.1% | 7.9% |
| Maximum | 58.1% | 55.4% |
| Range | 49.0% | 47.5% |
| Mean | 35.3% | 27.9% |
| Median | 31.9% | 26.9% |
| Interquartile 25% (IQ1) | 29.2% | 23.7% |
| Interquartile 75% (IQ3) | 41.5% | 29.9% |
| Interquartile Range (IQR) | 12.3% | 6.1% |
| Standard Deviation (Sample) | 13.0% | 8.3% |
| Standard Deviation (Population) | 12.4% | 8.2% |
Similar Demographics by Single Mother Poverty
Demographics Similar to Marshallese by Single Mother Poverty
In terms of single mother poverty, the demographic groups most similar to Marshallese are Nonimmigrants (32.2%, a difference of 0.22%), Cree (32.2%, a difference of 0.24%), Immigrants from the Azores (32.2%, a difference of 0.36%), Immigrants from Zaire (32.0%, a difference of 0.40%), and Spanish American (32.3%, a difference of 0.61%).
| Demographics | Rating | Rank | Single Mother Poverty |
| Immigrants | Micronesia | 0.1 /100 | #272 | Tragic 31.6% |
| Fijians | 0.1 /100 | #273 | Tragic 31.6% |
| Bangladeshis | 0.1 /100 | #274 | Tragic 31.7% |
| Central Americans | 0.1 /100 | #275 | Tragic 31.8% |
| Delaware | 0.0 /100 | #276 | Tragic 31.8% |
| Mexican American Indians | 0.0 /100 | #277 | Tragic 31.9% |
| Immigrants | Zaire | 0.0 /100 | #278 | Tragic 32.0% |
| Marshallese | 0.0 /100 | #279 | Tragic 32.1% |
| Immigrants | Nonimmigrants | 0.0 /100 | #280 | Tragic 32.2% |
| Cree | 0.0 /100 | #281 | Tragic 32.2% |
| Immigrants | Azores | 0.0 /100 | #282 | Tragic 32.2% |
| Spanish Americans | 0.0 /100 | #283 | Tragic 32.3% |
| Indonesians | 0.0 /100 | #284 | Tragic 32.4% |
| Immigrants | Latin America | 0.0 /100 | #285 | Tragic 32.4% |
| Yup'ik | 0.0 /100 | #286 | Tragic 32.5% |
Demographics Similar to Ethiopians by Single Mother Poverty
In terms of single mother poverty, the demographic groups most similar to Ethiopians are Afghan (27.7%, a difference of 0.020%), Immigrants from Ethiopia (27.7%, a difference of 0.020%), Immigrants from Ukraine (27.7%, a difference of 0.12%), Immigrants from France (27.8%, a difference of 0.19%), and Mongolian (27.7%, a difference of 0.21%).
| Demographics | Rating | Rank | Single Mother Poverty |
| Immigrants | Scotland | 98.9 /100 | #81 | Exceptional 27.6% |
| Immigrants | Cameroon | 98.8 /100 | #82 | Exceptional 27.6% |
| Greeks | 98.7 /100 | #83 | Exceptional 27.7% |
| Immigrants | Latvia | 98.7 /100 | #84 | Exceptional 27.7% |
| Mongolians | 98.7 /100 | #85 | Exceptional 27.7% |
| Immigrants | Ukraine | 98.6 /100 | #86 | Exceptional 27.7% |
| Afghans | 98.5 /100 | #87 | Exceptional 27.7% |
| Ethiopians | 98.4 /100 | #88 | Exceptional 27.7% |
| Immigrants | Ethiopia | 98.4 /100 | #89 | Exceptional 27.7% |
| Immigrants | France | 98.2 /100 | #90 | Exceptional 27.8% |
| Immigrants | Albania | 98.0 /100 | #91 | Exceptional 27.8% |
| Estonians | 97.9 /100 | #92 | Exceptional 27.8% |
| Romanians | 97.8 /100 | #93 | Exceptional 27.8% |
| Albanians | 97.6 /100 | #94 | Exceptional 27.9% |
| Chileans | 97.5 /100 | #95 | Exceptional 27.9% |