Arapaho vs Ethiopian Vision Disability
COMPARE
Arapaho
Ethiopian
Vision Disability
Vision Disability Comparison
Arapaho
Ethiopians
2.6%
VISION DISABILITY
0.0/ 100
METRIC RATING
308th/ 347
METRIC RANK
2.0%
VISION DISABILITY
99.7/ 100
METRIC RATING
45th/ 347
METRIC RANK
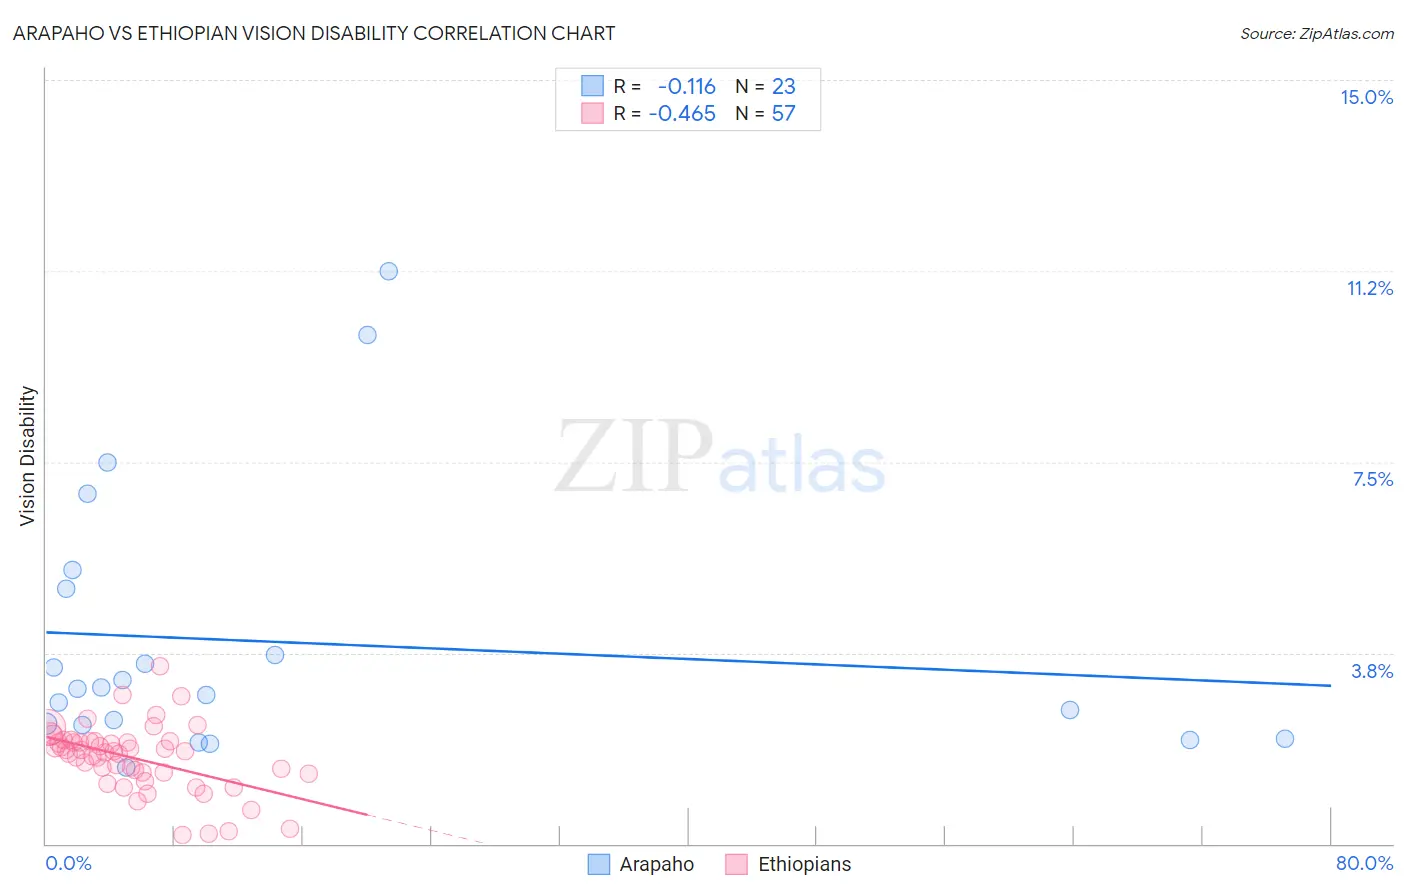
Arapaho vs Ethiopian Vision Disability Correlation Chart
The statistical analysis conducted on geographies consisting of 29,770,133 people shows a poor negative correlation between the proportion of Arapaho and percentage of population with vision disability in the United States with a correlation coefficient (R) of -0.116 and weighted average of 2.6%. Similarly, the statistical analysis conducted on geographies consisting of 223,170,588 people shows a moderate negative correlation between the proportion of Ethiopians and percentage of population with vision disability in the United States with a correlation coefficient (R) of -0.465 and weighted average of 2.0%, a difference of 32.3%.
Vision Disability Correlation Summary
| Measurement | Arapaho | Ethiopian |
| Minimum | 1.5% | 0.17% |
| Maximum | 11.2% | 3.5% |
| Range | 9.7% | 3.3% |
| Mean | 4.0% | 1.7% |
| Median | 3.1% | 1.8% |
| Interquartile 25% (IQ1) | 2.3% | 1.4% |
| Interquartile 75% (IQ3) | 5.0% | 2.0% |
| Interquartile Range (IQR) | 2.7% | 0.62% |
| Standard Deviation (Sample) | 2.6% | 0.65% |
| Standard Deviation (Population) | 2.5% | 0.64% |
Similar Demographics by Vision Disability
Demographics Similar to Arapaho by Vision Disability
In terms of vision disability, the demographic groups most similar to Arapaho are Immigrants from Dominican Republic (2.6%, a difference of 0.020%), Iroquois (2.6%, a difference of 0.040%), Immigrants from Yemen (2.6%, a difference of 0.29%), Blackfeet (2.6%, a difference of 0.61%), and Hispanic or Latino (2.6%, a difference of 0.65%).
| Demographics | Rating | Rank | Vision Disability |
| Menominee | 0.0 /100 | #301 | Tragic 2.5% |
| Spanish American Indians | 0.0 /100 | #302 | Tragic 2.6% |
| Immigrants | Cabo Verde | 0.0 /100 | #303 | Tragic 2.6% |
| Aleuts | 0.0 /100 | #304 | Tragic 2.6% |
| Hispanics or Latinos | 0.0 /100 | #305 | Tragic 2.6% |
| Iroquois | 0.0 /100 | #306 | Tragic 2.6% |
| Immigrants | Dominican Republic | 0.0 /100 | #307 | Tragic 2.6% |
| Arapaho | 0.0 /100 | #308 | Tragic 2.6% |
| Immigrants | Yemen | 0.0 /100 | #309 | Tragic 2.6% |
| Blackfeet | 0.0 /100 | #310 | Tragic 2.6% |
| Dominicans | 0.0 /100 | #311 | Tragic 2.6% |
| Americans | 0.0 /100 | #312 | Tragic 2.6% |
| Potawatomi | 0.0 /100 | #313 | Tragic 2.6% |
| Inupiat | 0.0 /100 | #314 | Tragic 2.7% |
| Osage | 0.0 /100 | #315 | Tragic 2.7% |
Demographics Similar to Ethiopians by Vision Disability
In terms of vision disability, the demographic groups most similar to Ethiopians are Immigrants from Indonesia (2.0%, a difference of 0.030%), Immigrants from Sweden (2.0%, a difference of 0.040%), Eastern European (2.0%, a difference of 0.050%), Immigrants from Bulgaria (2.0%, a difference of 0.060%), and Immigrants from Ethiopia (2.0%, a difference of 0.11%).
| Demographics | Rating | Rank | Vision Disability |
| Immigrants | Kuwait | 99.8 /100 | #38 | Exceptional 2.0% |
| Zimbabweans | 99.7 /100 | #39 | Exceptional 2.0% |
| Immigrants | Ireland | 99.7 /100 | #40 | Exceptional 2.0% |
| Cypriots | 99.7 /100 | #41 | Exceptional 2.0% |
| Immigrants | Ethiopia | 99.7 /100 | #42 | Exceptional 2.0% |
| Eastern Europeans | 99.7 /100 | #43 | Exceptional 2.0% |
| Immigrants | Indonesia | 99.7 /100 | #44 | Exceptional 2.0% |
| Ethiopians | 99.7 /100 | #45 | Exceptional 2.0% |
| Immigrants | Sweden | 99.7 /100 | #46 | Exceptional 2.0% |
| Immigrants | Bulgaria | 99.7 /100 | #47 | Exceptional 2.0% |
| Israelis | 99.6 /100 | #48 | Exceptional 2.0% |
| Latvians | 99.5 /100 | #49 | Exceptional 2.0% |
| Afghans | 99.5 /100 | #50 | Exceptional 2.0% |
| Tongans | 99.5 /100 | #51 | Exceptional 2.0% |
| Immigrants | Serbia | 99.4 /100 | #52 | Exceptional 2.0% |