Arapaho vs Canadian Single Mother Poverty
COMPARE
Arapaho
Canadian
Single Mother Poverty
Single Mother Poverty Comparison
Arapaho
Canadians
33.4%
SINGLE MOTHER POVERTY
0.0/ 100
METRIC RATING
302nd/ 347
METRIC RANK
29.3%
SINGLE MOTHER POVERTY
40.4/ 100
METRIC RATING
181st/ 347
METRIC RANK
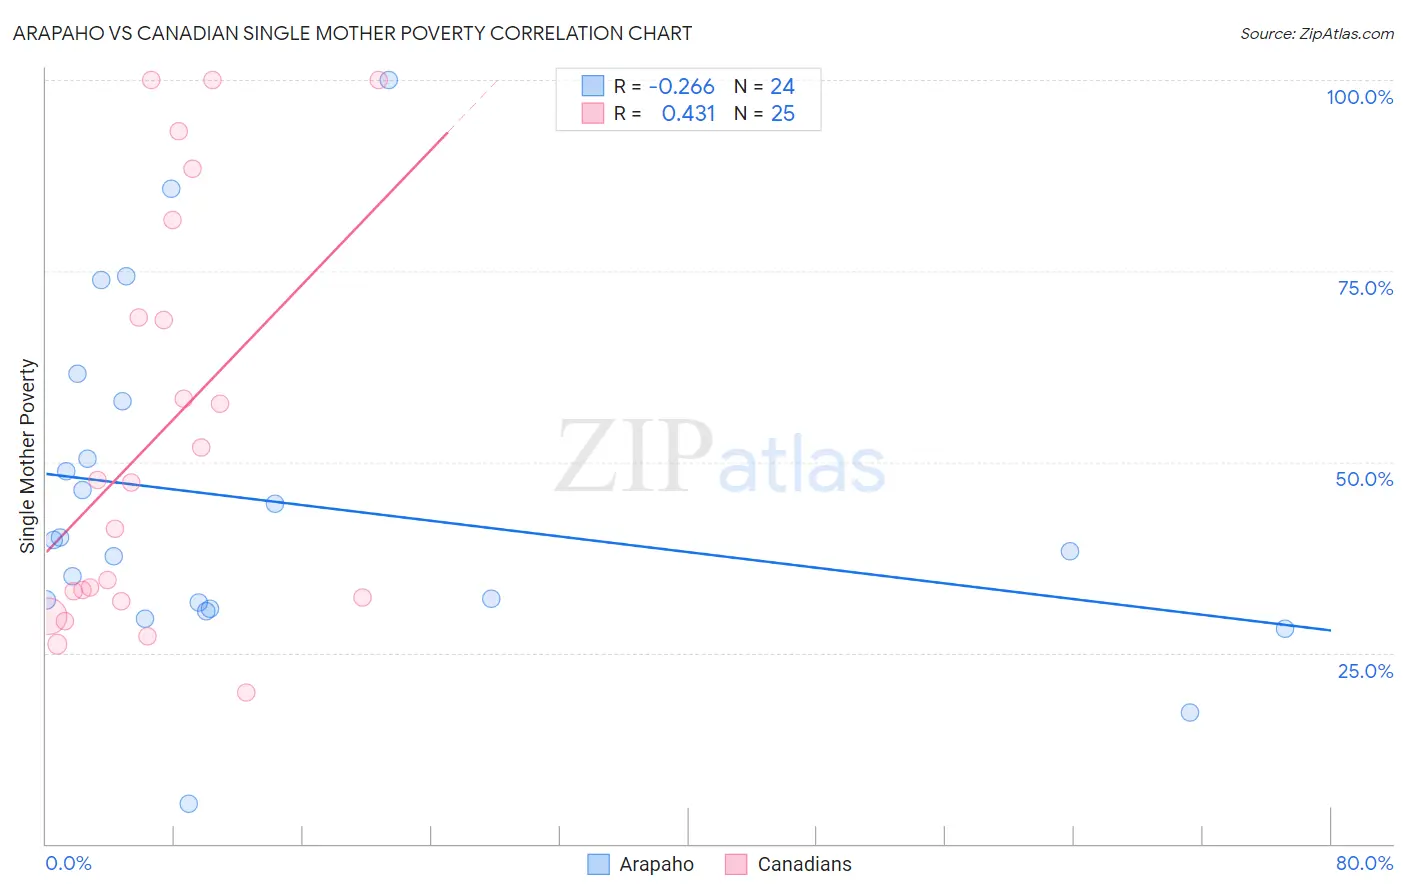
Arapaho vs Canadian Single Mother Poverty Correlation Chart
The statistical analysis conducted on geographies consisting of 29,572,302 people shows a weak negative correlation between the proportion of Arapaho and poverty level among single mothers in the United States with a correlation coefficient (R) of -0.266 and weighted average of 33.4%. Similarly, the statistical analysis conducted on geographies consisting of 423,799,902 people shows a moderate positive correlation between the proportion of Canadians and poverty level among single mothers in the United States with a correlation coefficient (R) of 0.431 and weighted average of 29.3%, a difference of 14.1%.
Single Mother Poverty Correlation Summary
| Measurement | Arapaho | Canadian |
| Minimum | 5.3% | 19.9% |
| Maximum | 100.0% | 100.0% |
| Range | 94.7% | 80.1% |
| Mean | 44.6% | 53.4% |
| Median | 39.0% | 47.3% |
| Interquartile 25% (IQ1) | 31.2% | 32.0% |
| Interquartile 75% (IQ3) | 54.1% | 75.3% |
| Interquartile Range (IQR) | 22.9% | 43.3% |
| Standard Deviation (Sample) | 21.8% | 26.7% |
| Standard Deviation (Population) | 21.3% | 26.1% |
Similar Demographics by Single Mother Poverty
Demographics Similar to Arapaho by Single Mother Poverty
In terms of single mother poverty, the demographic groups most similar to Arapaho are Immigrants from Somalia (33.4%, a difference of 0.15%), American (33.5%, a difference of 0.26%), Mexican (33.6%, a difference of 0.37%), Immigrants from Guatemala (33.3%, a difference of 0.39%), and Hispanic or Latino (33.3%, a difference of 0.39%).
| Demographics | Rating | Rank | Single Mother Poverty |
| Yaqui | 0.0 /100 | #295 | Tragic 33.1% |
| Blackfeet | 0.0 /100 | #296 | Tragic 33.2% |
| Pennsylvania Germans | 0.0 /100 | #297 | Tragic 33.2% |
| Africans | 0.0 /100 | #298 | Tragic 33.3% |
| Immigrants | Guatemala | 0.0 /100 | #299 | Tragic 33.3% |
| Hispanics or Latinos | 0.0 /100 | #300 | Tragic 33.3% |
| Immigrants | Somalia | 0.0 /100 | #301 | Tragic 33.4% |
| Arapaho | 0.0 /100 | #302 | Tragic 33.4% |
| Americans | 0.0 /100 | #303 | Tragic 33.5% |
| Mexicans | 0.0 /100 | #304 | Tragic 33.6% |
| Immigrants | Central America | 0.0 /100 | #305 | Tragic 33.6% |
| Immigrants | Congo | 0.0 /100 | #306 | Tragic 33.8% |
| Comanche | 0.0 /100 | #307 | Tragic 33.9% |
| Immigrants | Mexico | 0.0 /100 | #308 | Tragic 34.0% |
| Potawatomi | 0.0 /100 | #309 | Tragic 34.1% |
Demographics Similar to Canadians by Single Mother Poverty
In terms of single mother poverty, the demographic groups most similar to Canadians are Immigrants from Norway (29.3%, a difference of 0.060%), Immigrants from Eastern Africa (29.3%, a difference of 0.090%), Immigrants from Uzbekistan (29.3%, a difference of 0.11%), Nepalese (29.3%, a difference of 0.11%), and Nigerian (29.3%, a difference of 0.12%).
| Demographics | Rating | Rank | Single Mother Poverty |
| Immigrants | Saudi Arabia | 50.0 /100 | #174 | Average 29.2% |
| Immigrants | Costa Rica | 48.8 /100 | #175 | Average 29.2% |
| Hawaiians | 47.8 /100 | #176 | Average 29.2% |
| Immigrants | Bosnia and Herzegovina | 45.1 /100 | #177 | Average 29.2% |
| South American Indians | 43.2 /100 | #178 | Average 29.3% |
| Immigrants | Uzbekistan | 42.6 /100 | #179 | Average 29.3% |
| Immigrants | Norway | 41.5 /100 | #180 | Average 29.3% |
| Canadians | 40.4 /100 | #181 | Average 29.3% |
| Immigrants | Eastern Africa | 38.5 /100 | #182 | Fair 29.3% |
| Nepalese | 38.3 /100 | #183 | Fair 29.3% |
| Nigerians | 38.0 /100 | #184 | Fair 29.3% |
| Ghanaians | 36.8 /100 | #185 | Fair 29.4% |
| Yugoslavians | 36.0 /100 | #186 | Fair 29.4% |
| Lebanese | 32.5 /100 | #187 | Fair 29.4% |
| Guamanians/Chamorros | 31.8 /100 | #188 | Fair 29.4% |