Italian vs Ethiopian Single Mother Poverty
COMPARE
Italian
Ethiopian
Single Mother Poverty
Single Mother Poverty Comparison
Italians
Ethiopians
28.0%
SINGLE MOTHER POVERTY
96.6/ 100
METRIC RATING
104th/ 347
METRIC RANK
27.7%
SINGLE MOTHER POVERTY
98.4/ 100
METRIC RATING
88th/ 347
METRIC RANK
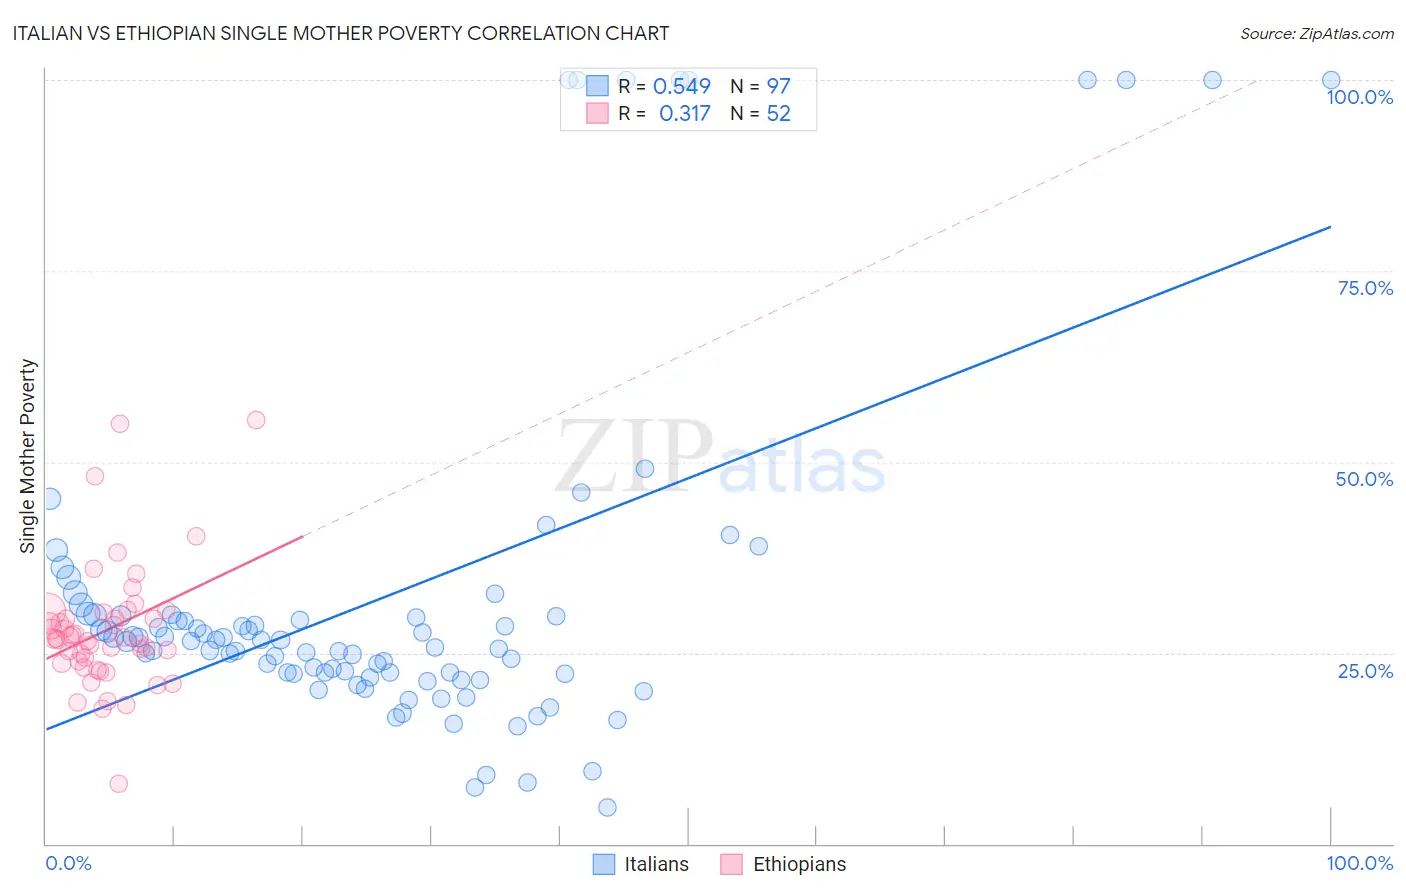
Italian vs Ethiopian Single Mother Poverty Correlation Chart
The statistical analysis conducted on geographies consisting of 546,043,185 people shows a substantial positive correlation between the proportion of Italians and poverty level among single mothers in the United States with a correlation coefficient (R) of 0.549 and weighted average of 28.0%. Similarly, the statistical analysis conducted on geographies consisting of 220,975,245 people shows a mild positive correlation between the proportion of Ethiopians and poverty level among single mothers in the United States with a correlation coefficient (R) of 0.317 and weighted average of 27.7%, a difference of 1.0%.
Single Mother Poverty Correlation Summary
| Measurement | Italian | Ethiopian |
| Minimum | 4.7% | 7.9% |
| Maximum | 100.0% | 55.4% |
| Range | 95.3% | 47.5% |
| Mean | 32.3% | 27.9% |
| Median | 26.6% | 26.9% |
| Interquartile 25% (IQ1) | 22.3% | 23.7% |
| Interquartile 75% (IQ3) | 29.9% | 29.9% |
| Interquartile Range (IQR) | 7.6% | 6.1% |
| Standard Deviation (Sample) | 23.0% | 8.3% |
| Standard Deviation (Population) | 22.9% | 8.2% |
Demographics Similar to Italians and Ethiopians by Single Mother Poverty
In terms of single mother poverty, the demographic groups most similar to Italians are Immigrants from Northern Africa (28.0%, a difference of 0.020%), Israeli (28.0%, a difference of 0.020%), Immigrants from Croatia (28.0%, a difference of 0.030%), Ukrainian (28.0%, a difference of 0.070%), and Pakistani (28.0%, a difference of 0.14%). Similarly, the demographic groups most similar to Ethiopians are Afghan (27.7%, a difference of 0.020%), Immigrants from Ethiopia (27.7%, a difference of 0.020%), Immigrants from Ukraine (27.7%, a difference of 0.12%), Immigrants from France (27.8%, a difference of 0.19%), and Immigrants from Albania (27.8%, a difference of 0.34%).
| Demographics | Rating | Rank | Single Mother Poverty |
| Immigrants | Ukraine | 98.6 /100 | #86 | Exceptional 27.7% |
| Afghans | 98.5 /100 | #87 | Exceptional 27.7% |
| Ethiopians | 98.4 /100 | #88 | Exceptional 27.7% |
| Immigrants | Ethiopia | 98.4 /100 | #89 | Exceptional 27.7% |
| Immigrants | France | 98.2 /100 | #90 | Exceptional 27.8% |
| Immigrants | Albania | 98.0 /100 | #91 | Exceptional 27.8% |
| Estonians | 97.9 /100 | #92 | Exceptional 27.8% |
| Romanians | 97.8 /100 | #93 | Exceptional 27.8% |
| Albanians | 97.6 /100 | #94 | Exceptional 27.9% |
| Chileans | 97.5 /100 | #95 | Exceptional 27.9% |
| Immigrants | Iraq | 97.3 /100 | #96 | Exceptional 27.9% |
| Immigrants | Brazil | 97.2 /100 | #97 | Exceptional 27.9% |
| Immigrants | Nepal | 97.2 /100 | #98 | Exceptional 27.9% |
| Immigrants | Netherlands | 97.2 /100 | #99 | Exceptional 27.9% |
| Zimbabweans | 97.1 /100 | #100 | Exceptional 27.9% |
| Pakistanis | 96.9 /100 | #101 | Exceptional 28.0% |
| Immigrants | Croatia | 96.7 /100 | #102 | Exceptional 28.0% |
| Immigrants | Northern Africa | 96.6 /100 | #103 | Exceptional 28.0% |
| Italians | 96.6 /100 | #104 | Exceptional 28.0% |
| Israelis | 96.5 /100 | #105 | Exceptional 28.0% |
| Ukrainians | 96.4 /100 | #106 | Exceptional 28.0% |