Arab vs Nonimmigrants Single Father Poverty
COMPARE
Arab
Nonimmigrants
Single Father Poverty
Single Father Poverty Comparison
Arabs
Nonimmigrants
16.6%
SINGLE FATHER POVERTY
12.8/ 100
METRIC RATING
211th/ 347
METRIC RANK
18.8%
SINGLE FATHER POVERTY
0.0/ 100
METRIC RATING
311th/ 347
METRIC RANK
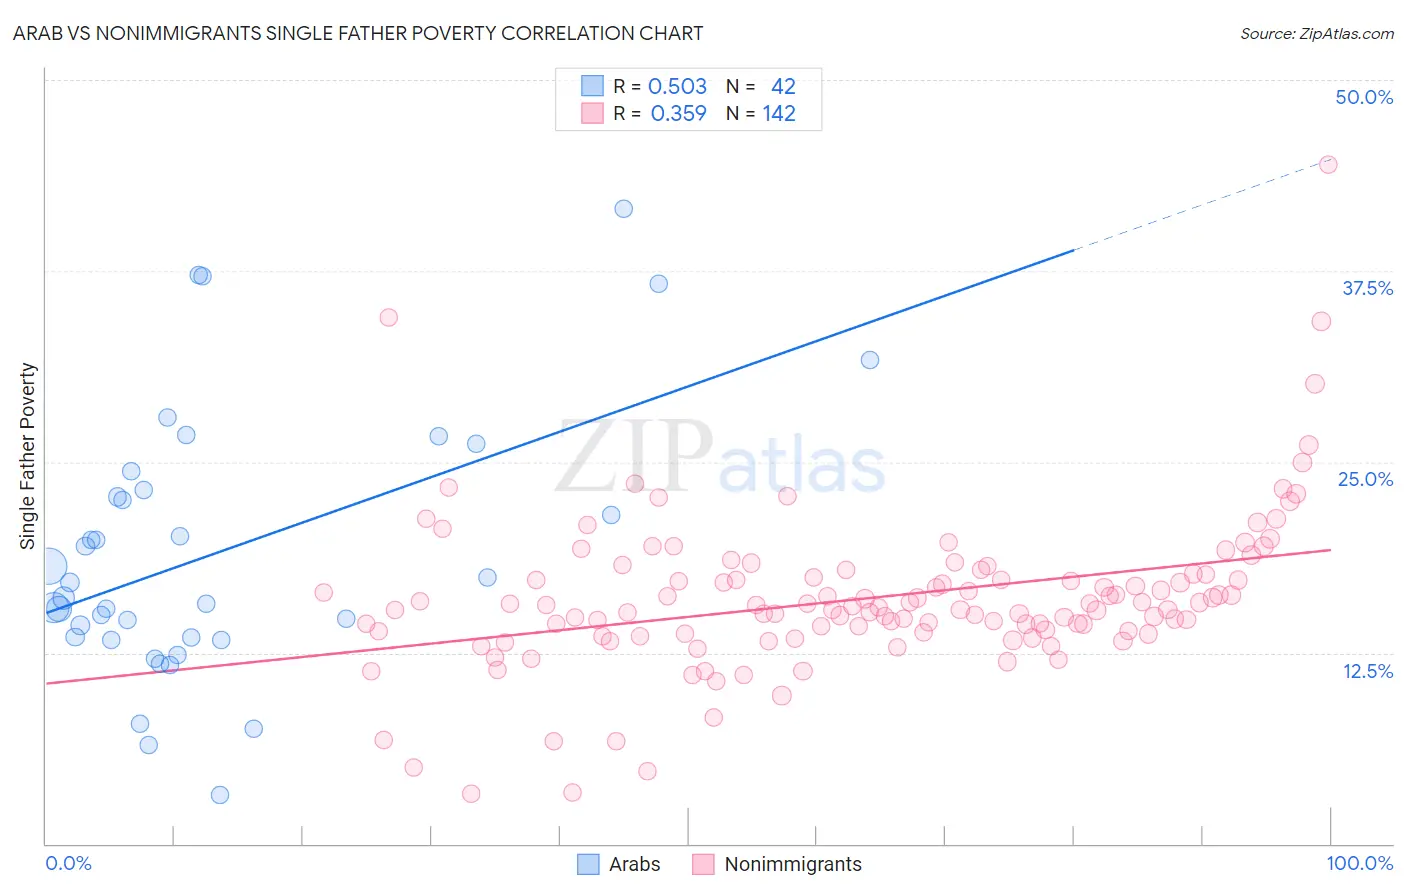
Arab vs Nonimmigrants Single Father Poverty Correlation Chart
The statistical analysis conducted on geographies consisting of 369,349,186 people shows a substantial positive correlation between the proportion of Arabs and poverty level among single fathers in the United States with a correlation coefficient (R) of 0.503 and weighted average of 16.6%. Similarly, the statistical analysis conducted on geographies consisting of 414,706,444 people shows a mild positive correlation between the proportion of Nonimmigrants and poverty level among single fathers in the United States with a correlation coefficient (R) of 0.359 and weighted average of 18.8%, a difference of 13.3%.
Single Father Poverty Correlation Summary
| Measurement | Arab | Nonimmigrants |
| Minimum | 3.2% | 3.3% |
| Maximum | 41.6% | 44.5% |
| Range | 38.4% | 41.2% |
| Mean | 19.1% | 16.1% |
| Median | 16.6% | 15.5% |
| Interquartile 25% (IQ1) | 13.5% | 13.9% |
| Interquartile 75% (IQ3) | 23.1% | 17.6% |
| Interquartile Range (IQR) | 9.6% | 3.8% |
| Standard Deviation (Sample) | 8.7% | 5.2% |
| Standard Deviation (Population) | 8.6% | 5.2% |
Similar Demographics by Single Father Poverty
Demographics Similar to Arabs by Single Father Poverty
In terms of single father poverty, the demographic groups most similar to Arabs are Guatemalan (16.6%, a difference of 0.0%), European (16.6%, a difference of 0.030%), Immigrants from Senegal (16.6%, a difference of 0.080%), New Zealander (16.6%, a difference of 0.080%), and Eastern European (16.6%, a difference of 0.080%).
| Demographics | Rating | Rank | Single Father Poverty |
| Immigrants | Guatemala | 14.8 /100 | #204 | Poor 16.6% |
| Venezuelans | 14.3 /100 | #205 | Poor 16.6% |
| Immigrants | Senegal | 13.7 /100 | #206 | Poor 16.6% |
| New Zealanders | 13.7 /100 | #207 | Poor 16.6% |
| Eastern Europeans | 13.7 /100 | #208 | Poor 16.6% |
| Europeans | 13.2 /100 | #209 | Poor 16.6% |
| Guatemalans | 12.9 /100 | #210 | Poor 16.6% |
| Arabs | 12.8 /100 | #211 | Poor 16.6% |
| Immigrants | Southern Europe | 11.2 /100 | #212 | Poor 16.7% |
| Ghanaians | 11.0 /100 | #213 | Poor 16.7% |
| Spanish | 10.7 /100 | #214 | Poor 16.7% |
| Immigrants | Scotland | 9.6 /100 | #215 | Tragic 16.7% |
| Immigrants | England | 9.5 /100 | #216 | Tragic 16.7% |
| Cheyenne | 9.3 /100 | #217 | Tragic 16.7% |
| Immigrants | Uganda | 8.6 /100 | #218 | Tragic 16.7% |
Demographics Similar to Nonimmigrants by Single Father Poverty
In terms of single father poverty, the demographic groups most similar to Nonimmigrants are Immigrants from Dominica (18.9%, a difference of 0.050%), Chippewa (18.8%, a difference of 0.19%), Potawatomi (18.9%, a difference of 0.25%), Delaware (18.9%, a difference of 0.42%), and Chickasaw (19.0%, a difference of 0.57%).
| Demographics | Rating | Rank | Single Father Poverty |
| Ute | 0.0 /100 | #304 | Tragic 18.5% |
| Blackfeet | 0.0 /100 | #305 | Tragic 18.5% |
| Scotch-Irish | 0.0 /100 | #306 | Tragic 18.6% |
| French Canadians | 0.0 /100 | #307 | Tragic 18.6% |
| Ottawa | 0.0 /100 | #308 | Tragic 18.6% |
| Immigrants | Micronesia | 0.0 /100 | #309 | Tragic 18.6% |
| Chippewa | 0.0 /100 | #310 | Tragic 18.8% |
| Immigrants | Nonimmigrants | 0.0 /100 | #311 | Tragic 18.8% |
| Immigrants | Dominica | 0.0 /100 | #312 | Tragic 18.9% |
| Potawatomi | 0.0 /100 | #313 | Tragic 18.9% |
| Delaware | 0.0 /100 | #314 | Tragic 18.9% |
| Chickasaw | 0.0 /100 | #315 | Tragic 19.0% |
| Osage | 0.0 /100 | #316 | Tragic 19.0% |
| Dominicans | 0.0 /100 | #317 | Tragic 19.1% |
| Dutch West Indians | 0.0 /100 | #318 | Tragic 19.2% |