Arab vs Immigrants from Jordan Single Father Poverty
COMPARE
Arab
Immigrants from Jordan
Single Father Poverty
Single Father Poverty Comparison
Arabs
Immigrants from Jordan
16.6%
SINGLE FATHER POVERTY
12.8/ 100
METRIC RATING
211th/ 347
METRIC RANK
16.2%
SINGLE FATHER POVERTY
66.0/ 100
METRIC RATING
156th/ 347
METRIC RANK
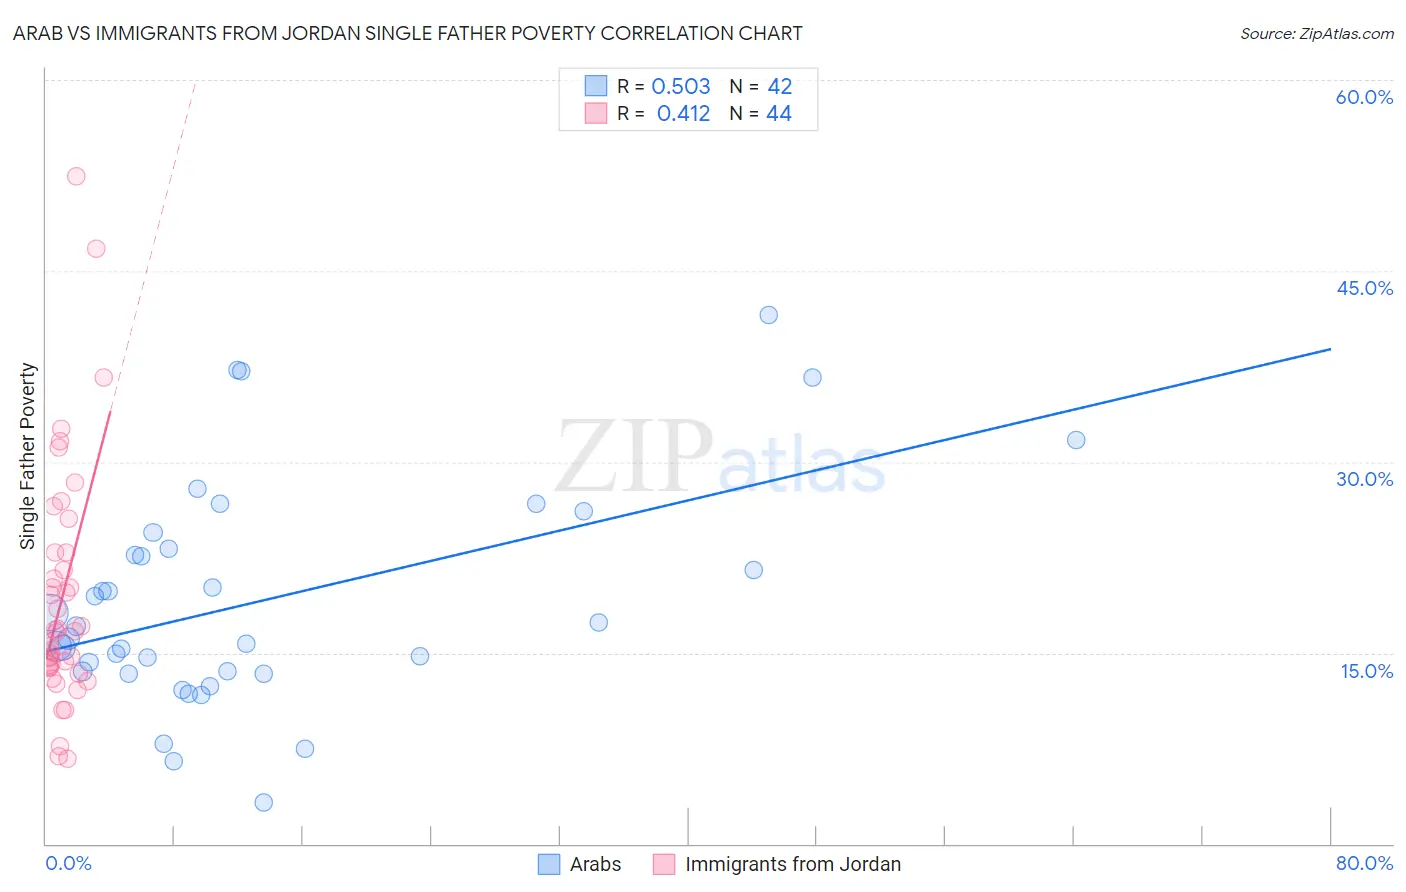
Arab vs Immigrants from Jordan Single Father Poverty Correlation Chart
The statistical analysis conducted on geographies consisting of 369,349,186 people shows a substantial positive correlation between the proportion of Arabs and poverty level among single fathers in the United States with a correlation coefficient (R) of 0.503 and weighted average of 16.6%. Similarly, the statistical analysis conducted on geographies consisting of 156,428,071 people shows a moderate positive correlation between the proportion of Immigrants from Jordan and poverty level among single fathers in the United States with a correlation coefficient (R) of 0.412 and weighted average of 16.2%, a difference of 2.9%.
Single Father Poverty Correlation Summary
| Measurement | Arab | Immigrants from Jordan |
| Minimum | 3.2% | 6.7% |
| Maximum | 41.6% | 52.4% |
| Range | 38.4% | 45.8% |
| Mean | 19.1% | 19.5% |
| Median | 16.6% | 16.7% |
| Interquartile 25% (IQ1) | 13.5% | 13.9% |
| Interquartile 75% (IQ3) | 23.1% | 22.9% |
| Interquartile Range (IQR) | 9.6% | 8.9% |
| Standard Deviation (Sample) | 8.7% | 9.6% |
| Standard Deviation (Population) | 8.6% | 9.5% |
Similar Demographics by Single Father Poverty
Demographics Similar to Arabs by Single Father Poverty
In terms of single father poverty, the demographic groups most similar to Arabs are Guatemalan (16.6%, a difference of 0.0%), European (16.6%, a difference of 0.030%), Immigrants from Senegal (16.6%, a difference of 0.080%), New Zealander (16.6%, a difference of 0.080%), and Eastern European (16.6%, a difference of 0.080%).
| Demographics | Rating | Rank | Single Father Poverty |
| Immigrants | Guatemala | 14.8 /100 | #204 | Poor 16.6% |
| Venezuelans | 14.3 /100 | #205 | Poor 16.6% |
| Immigrants | Senegal | 13.7 /100 | #206 | Poor 16.6% |
| New Zealanders | 13.7 /100 | #207 | Poor 16.6% |
| Eastern Europeans | 13.7 /100 | #208 | Poor 16.6% |
| Europeans | 13.2 /100 | #209 | Poor 16.6% |
| Guatemalans | 12.9 /100 | #210 | Poor 16.6% |
| Arabs | 12.8 /100 | #211 | Poor 16.6% |
| Immigrants | Southern Europe | 11.2 /100 | #212 | Poor 16.7% |
| Ghanaians | 11.0 /100 | #213 | Poor 16.7% |
| Spanish | 10.7 /100 | #214 | Poor 16.7% |
| Immigrants | Scotland | 9.6 /100 | #215 | Tragic 16.7% |
| Immigrants | England | 9.5 /100 | #216 | Tragic 16.7% |
| Cheyenne | 9.3 /100 | #217 | Tragic 16.7% |
| Immigrants | Uganda | 8.6 /100 | #218 | Tragic 16.7% |
Demographics Similar to Immigrants from Jordan by Single Father Poverty
In terms of single father poverty, the demographic groups most similar to Immigrants from Jordan are Immigrants from Nicaragua (16.2%, a difference of 0.090%), Immigrants from Czechoslovakia (16.2%, a difference of 0.16%), Portuguese (16.2%, a difference of 0.18%), Mexican (16.1%, a difference of 0.21%), and Belizean (16.2%, a difference of 0.29%).
| Demographics | Rating | Rank | Single Father Poverty |
| South Africans | 75.1 /100 | #149 | Good 16.1% |
| Jordanians | 74.2 /100 | #150 | Good 16.1% |
| Immigrants | France | 73.1 /100 | #151 | Good 16.1% |
| Immigrants | Zimbabwe | 72.1 /100 | #152 | Good 16.1% |
| Immigrants | Israel | 72.0 /100 | #153 | Good 16.1% |
| Mexicans | 70.1 /100 | #154 | Good 16.1% |
| Immigrants | Nicaragua | 67.8 /100 | #155 | Good 16.2% |
| Immigrants | Jordan | 66.0 /100 | #156 | Good 16.2% |
| Immigrants | Czechoslovakia | 62.8 /100 | #157 | Good 16.2% |
| Portuguese | 62.3 /100 | #158 | Good 16.2% |
| Belizeans | 59.9 /100 | #159 | Average 16.2% |
| Immigrants | Sudan | 59.8 /100 | #160 | Average 16.2% |
| Estonians | 56.7 /100 | #161 | Average 16.2% |
| Ugandans | 55.9 /100 | #162 | Average 16.3% |
| Immigrants | Costa Rica | 55.7 /100 | #163 | Average 16.3% |