Arab vs Scandinavian Average Family Size
COMPARE
Arab
Scandinavian
Average Family Size
Average Family Size Comparison
Arabs
Scandinavians
3.23
AVERAGE FAMILY SIZE
53.8/ 100
METRIC RATING
170th/ 347
METRIC RANK
3.14
AVERAGE FAMILY SIZE
0.2/ 100
METRIC RATING
293rd/ 347
METRIC RANK
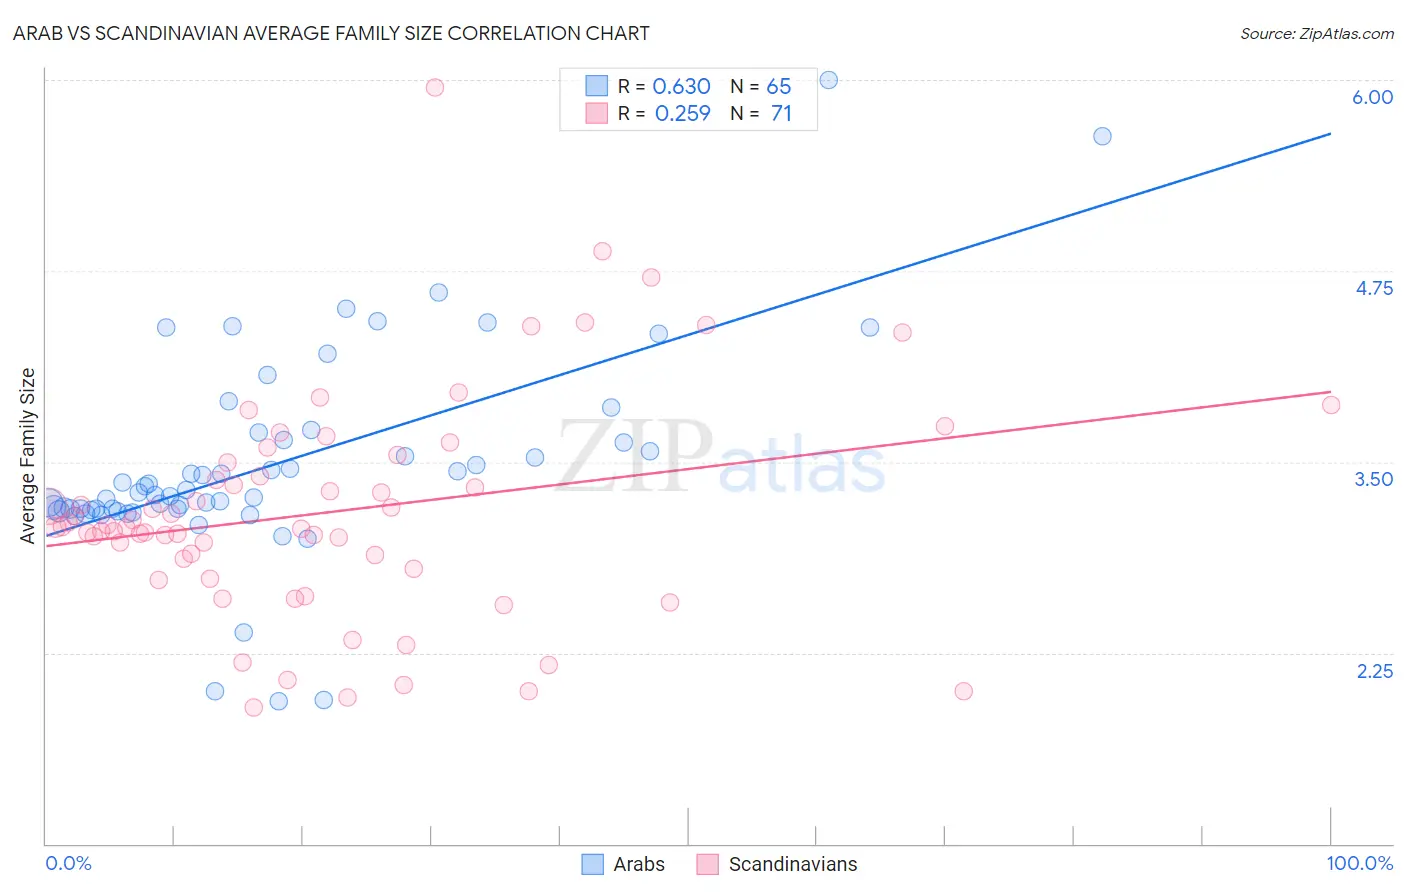
Arab vs Scandinavian Average Family Size Correlation Chart
The statistical analysis conducted on geographies consisting of 486,389,490 people shows a significant positive correlation between the proportion of Arabs and average family size in the United States with a correlation coefficient (R) of 0.630 and weighted average of 3.23. Similarly, the statistical analysis conducted on geographies consisting of 472,285,775 people shows a weak positive correlation between the proportion of Scandinavians and average family size in the United States with a correlation coefficient (R) of 0.259 and weighted average of 3.14, a difference of 2.9%.
Average Family Size Correlation Summary
| Measurement | Arab | Scandinavian |
| Minimum | 1.93 | 1.89 |
| Maximum | 6.00 | 5.95 |
| Range | 4.07 | 4.06 |
| Mean | 3.49 | 3.17 |
| Median | 3.30 | 3.07 |
| Interquartile 25% (IQ1) | 3.19 | 2.80 |
| Interquartile 75% (IQ3) | 3.67 | 3.49 |
| Interquartile Range (IQR) | 0.48 | 0.69 |
| Standard Deviation (Sample) | 0.69 | 0.73 |
| Standard Deviation (Population) | 0.68 | 0.72 |
Similar Demographics by Average Family Size
Demographics Similar to Arabs by Average Family Size
In terms of average family size, the demographic groups most similar to Arabs are Taiwanese (3.23, a difference of 0.010%), Aleut (3.23, a difference of 0.010%), Chilean (3.23, a difference of 0.010%), Immigrants from Congo (3.23, a difference of 0.020%), and Immigrants from Uruguay (3.23, a difference of 0.030%).
| Demographics | Rating | Rank | Average Family Size |
| Uruguayans | 58.8 /100 | #163 | Average 3.23 |
| Egyptians | 58.6 /100 | #164 | Average 3.23 |
| Ugandans | 58.4 /100 | #165 | Average 3.23 |
| Immigrants | Senegal | 57.5 /100 | #166 | Average 3.23 |
| Dutch West Indians | 56.9 /100 | #167 | Average 3.23 |
| Taiwanese | 54.2 /100 | #168 | Average 3.23 |
| Aleuts | 54.1 /100 | #169 | Average 3.23 |
| Arabs | 53.8 /100 | #170 | Average 3.23 |
| Chileans | 53.2 /100 | #171 | Average 3.23 |
| Immigrants | Congo | 52.7 /100 | #172 | Average 3.23 |
| Immigrants | Uruguay | 52.0 /100 | #173 | Average 3.23 |
| Immigrants | South Central Asia | 50.0 /100 | #174 | Average 3.23 |
| Immigrants | China | 49.9 /100 | #175 | Average 3.23 |
| Israelis | 48.7 /100 | #176 | Average 3.23 |
| Argentineans | 47.4 /100 | #177 | Average 3.23 |
Demographics Similar to Scandinavians by Average Family Size
In terms of average family size, the demographic groups most similar to Scandinavians are European (3.14, a difference of 0.010%), Immigrants from Croatia (3.14, a difference of 0.020%), Alsatian (3.14, a difference of 0.030%), Austrian (3.14, a difference of 0.030%), and Ukrainian (3.14, a difference of 0.030%).
| Demographics | Rating | Rank | Average Family Size |
| Immigrants | Netherlands | 0.3 /100 | #286 | Tragic 3.14 |
| Greeks | 0.3 /100 | #287 | Tragic 3.14 |
| Immigrants | Czechoslovakia | 0.3 /100 | #288 | Tragic 3.14 |
| Immigrants | Norway | 0.3 /100 | #289 | Tragic 3.14 |
| Cypriots | 0.3 /100 | #290 | Tragic 3.14 |
| Alsatians | 0.2 /100 | #291 | Tragic 3.14 |
| Europeans | 0.2 /100 | #292 | Tragic 3.14 |
| Scandinavians | 0.2 /100 | #293 | Tragic 3.14 |
| Immigrants | Croatia | 0.2 /100 | #294 | Tragic 3.14 |
| Austrians | 0.2 /100 | #295 | Tragic 3.14 |
| Ukrainians | 0.2 /100 | #296 | Tragic 3.14 |
| Immigrants | Western Europe | 0.2 /100 | #297 | Tragic 3.14 |
| Colville | 0.2 /100 | #298 | Tragic 3.14 |
| Canadians | 0.2 /100 | #299 | Tragic 3.14 |
| Immigrants | Sweden | 0.2 /100 | #300 | Tragic 3.14 |