Arab vs Australian Single Father Poverty
COMPARE
Arab
Australian
Single Father Poverty
Single Father Poverty Comparison
Arabs
Australians
16.6%
SINGLE FATHER POVERTY
12.8/ 100
METRIC RATING
211th/ 347
METRIC RANK
15.7%
SINGLE FATHER POVERTY
96.1/ 100
METRIC RATING
104th/ 347
METRIC RANK
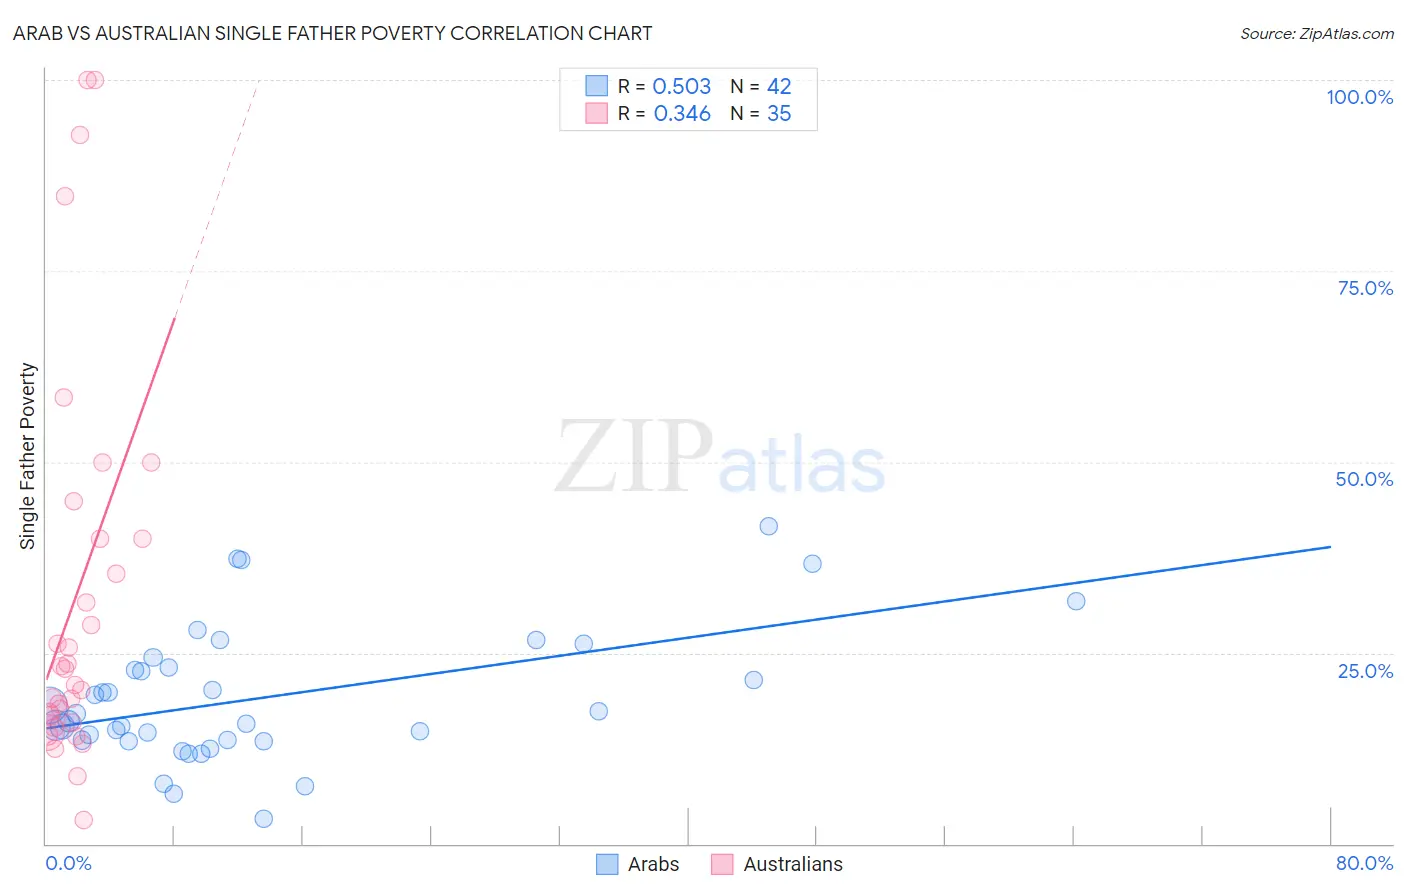
Arab vs Australian Single Father Poverty Correlation Chart
The statistical analysis conducted on geographies consisting of 369,349,186 people shows a substantial positive correlation between the proportion of Arabs and poverty level among single fathers in the United States with a correlation coefficient (R) of 0.503 and weighted average of 16.6%. Similarly, the statistical analysis conducted on geographies consisting of 185,666,676 people shows a mild positive correlation between the proportion of Australians and poverty level among single fathers in the United States with a correlation coefficient (R) of 0.346 and weighted average of 15.7%, a difference of 5.9%.
Single Father Poverty Correlation Summary
| Measurement | Arab | Australian |
| Minimum | 3.2% | 3.1% |
| Maximum | 41.6% | 100.0% |
| Range | 38.4% | 96.9% |
| Mean | 19.1% | 32.5% |
| Median | 16.6% | 22.9% |
| Interquartile 25% (IQ1) | 13.5% | 15.8% |
| Interquartile 75% (IQ3) | 23.1% | 40.0% |
| Interquartile Range (IQR) | 9.6% | 24.2% |
| Standard Deviation (Sample) | 8.7% | 25.8% |
| Standard Deviation (Population) | 8.6% | 25.5% |
Similar Demographics by Single Father Poverty
Demographics Similar to Arabs by Single Father Poverty
In terms of single father poverty, the demographic groups most similar to Arabs are Guatemalan (16.6%, a difference of 0.0%), European (16.6%, a difference of 0.030%), Immigrants from Senegal (16.6%, a difference of 0.080%), New Zealander (16.6%, a difference of 0.080%), and Eastern European (16.6%, a difference of 0.080%).
| Demographics | Rating | Rank | Single Father Poverty |
| Immigrants | Guatemala | 14.8 /100 | #204 | Poor 16.6% |
| Venezuelans | 14.3 /100 | #205 | Poor 16.6% |
| Immigrants | Senegal | 13.7 /100 | #206 | Poor 16.6% |
| New Zealanders | 13.7 /100 | #207 | Poor 16.6% |
| Eastern Europeans | 13.7 /100 | #208 | Poor 16.6% |
| Europeans | 13.2 /100 | #209 | Poor 16.6% |
| Guatemalans | 12.9 /100 | #210 | Poor 16.6% |
| Arabs | 12.8 /100 | #211 | Poor 16.6% |
| Immigrants | Southern Europe | 11.2 /100 | #212 | Poor 16.7% |
| Ghanaians | 11.0 /100 | #213 | Poor 16.7% |
| Spanish | 10.7 /100 | #214 | Poor 16.7% |
| Immigrants | Scotland | 9.6 /100 | #215 | Tragic 16.7% |
| Immigrants | England | 9.5 /100 | #216 | Tragic 16.7% |
| Cheyenne | 9.3 /100 | #217 | Tragic 16.7% |
| Immigrants | Uganda | 8.6 /100 | #218 | Tragic 16.7% |
Demographics Similar to Australians by Single Father Poverty
In terms of single father poverty, the demographic groups most similar to Australians are Immigrants from Australia (15.7%, a difference of 0.010%), South American Indian (15.7%, a difference of 0.020%), Chilean (15.7%, a difference of 0.080%), Immigrants from Poland (15.7%, a difference of 0.080%), and Native Hawaiian (15.7%, a difference of 0.10%).
| Demographics | Rating | Rank | Single Father Poverty |
| Yaqui | 98.1 /100 | #97 | Exceptional 15.6% |
| Zimbabweans | 98.1 /100 | #98 | Exceptional 15.6% |
| Immigrants | Middle Africa | 97.4 /100 | #99 | Exceptional 15.6% |
| Immigrants | Chile | 96.9 /100 | #100 | Exceptional 15.7% |
| Fijians | 96.8 /100 | #101 | Exceptional 15.7% |
| Chileans | 96.4 /100 | #102 | Exceptional 15.7% |
| South American Indians | 96.2 /100 | #103 | Exceptional 15.7% |
| Australians | 96.1 /100 | #104 | Exceptional 15.7% |
| Immigrants | Australia | 96.1 /100 | #105 | Exceptional 15.7% |
| Immigrants | Poland | 95.8 /100 | #106 | Exceptional 15.7% |
| Native Hawaiians | 95.8 /100 | #107 | Exceptional 15.7% |
| Pakistanis | 95.7 /100 | #108 | Exceptional 15.7% |
| Turks | 95.1 /100 | #109 | Exceptional 15.8% |
| Immigrants | Africa | 95.1 /100 | #110 | Exceptional 15.8% |
| Bulgarians | 94.8 /100 | #111 | Exceptional 15.8% |