Arab vs Immigrants from Syria Single Father Poverty
COMPARE
Arab
Immigrants from Syria
Single Father Poverty
Single Father Poverty Comparison
Arabs
Immigrants from Syria
16.6%
SINGLE FATHER POVERTY
12.8/ 100
METRIC RATING
211th/ 347
METRIC RANK
15.9%
SINGLE FATHER POVERTY
89.5/ 100
METRIC RATING
133rd/ 347
METRIC RANK
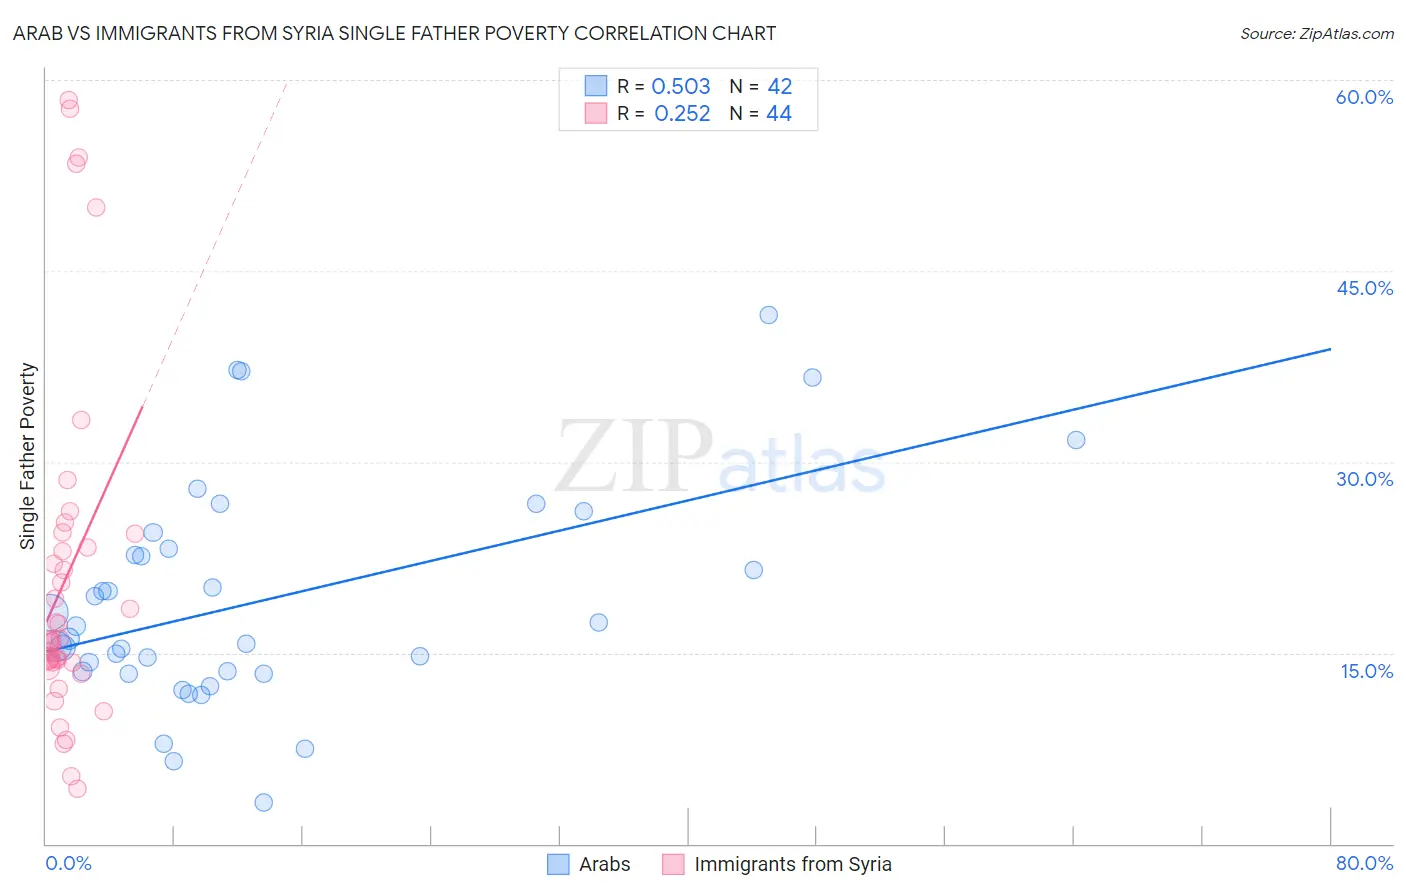
Arab vs Immigrants from Syria Single Father Poverty Correlation Chart
The statistical analysis conducted on geographies consisting of 369,349,186 people shows a substantial positive correlation between the proportion of Arabs and poverty level among single fathers in the United States with a correlation coefficient (R) of 0.503 and weighted average of 16.6%. Similarly, the statistical analysis conducted on geographies consisting of 149,904,118 people shows a weak positive correlation between the proportion of Immigrants from Syria and poverty level among single fathers in the United States with a correlation coefficient (R) of 0.252 and weighted average of 15.9%, a difference of 4.6%.
Single Father Poverty Correlation Summary
| Measurement | Arab | Immigrants from Syria |
| Minimum | 3.2% | 4.4% |
| Maximum | 41.6% | 58.5% |
| Range | 38.4% | 54.1% |
| Mean | 19.1% | 21.0% |
| Median | 16.6% | 16.0% |
| Interquartile 25% (IQ1) | 13.5% | 14.3% |
| Interquartile 75% (IQ3) | 23.1% | 23.8% |
| Interquartile Range (IQR) | 9.6% | 9.5% |
| Standard Deviation (Sample) | 8.7% | 13.6% |
| Standard Deviation (Population) | 8.6% | 13.4% |
Similar Demographics by Single Father Poverty
Demographics Similar to Arabs by Single Father Poverty
In terms of single father poverty, the demographic groups most similar to Arabs are Guatemalan (16.6%, a difference of 0.0%), European (16.6%, a difference of 0.030%), Immigrants from Senegal (16.6%, a difference of 0.080%), New Zealander (16.6%, a difference of 0.080%), and Eastern European (16.6%, a difference of 0.080%).
| Demographics | Rating | Rank | Single Father Poverty |
| Immigrants | Guatemala | 14.8 /100 | #204 | Poor 16.6% |
| Venezuelans | 14.3 /100 | #205 | Poor 16.6% |
| Immigrants | Senegal | 13.7 /100 | #206 | Poor 16.6% |
| New Zealanders | 13.7 /100 | #207 | Poor 16.6% |
| Eastern Europeans | 13.7 /100 | #208 | Poor 16.6% |
| Europeans | 13.2 /100 | #209 | Poor 16.6% |
| Guatemalans | 12.9 /100 | #210 | Poor 16.6% |
| Arabs | 12.8 /100 | #211 | Poor 16.6% |
| Immigrants | Southern Europe | 11.2 /100 | #212 | Poor 16.7% |
| Ghanaians | 11.0 /100 | #213 | Poor 16.7% |
| Spanish | 10.7 /100 | #214 | Poor 16.7% |
| Immigrants | Scotland | 9.6 /100 | #215 | Tragic 16.7% |
| Immigrants | England | 9.5 /100 | #216 | Tragic 16.7% |
| Cheyenne | 9.3 /100 | #217 | Tragic 16.7% |
| Immigrants | Uganda | 8.6 /100 | #218 | Tragic 16.7% |
Demographics Similar to Immigrants from Syria by Single Father Poverty
In terms of single father poverty, the demographic groups most similar to Immigrants from Syria are Immigrants from Portugal (15.9%, a difference of 0.020%), Nicaraguan (15.9%, a difference of 0.070%), Norwegian (15.9%, a difference of 0.080%), Immigrants from South America (15.9%, a difference of 0.12%), and Immigrants from Sri Lanka (15.9%, a difference of 0.15%).
| Demographics | Rating | Rank | Single Father Poverty |
| Hmong | 91.1 /100 | #126 | Exceptional 15.9% |
| Immigrants | Liberia | 91.1 /100 | #127 | Exceptional 15.9% |
| Immigrants | Nigeria | 90.8 /100 | #128 | Exceptional 15.9% |
| Immigrants | West Indies | 90.8 /100 | #129 | Exceptional 15.9% |
| Norwegians | 90.2 /100 | #130 | Exceptional 15.9% |
| Nicaraguans | 90.1 /100 | #131 | Exceptional 15.9% |
| Immigrants | Portugal | 89.7 /100 | #132 | Excellent 15.9% |
| Immigrants | Syria | 89.5 /100 | #133 | Excellent 15.9% |
| Immigrants | South America | 88.5 /100 | #134 | Excellent 15.9% |
| Immigrants | Sri Lanka | 88.2 /100 | #135 | Excellent 15.9% |
| Cypriots | 87.5 /100 | #136 | Excellent 15.9% |
| Immigrants | Azores | 87.2 /100 | #137 | Excellent 15.9% |
| Central Americans | 87.1 /100 | #138 | Excellent 16.0% |
| South Americans | 85.9 /100 | #139 | Excellent 16.0% |
| Immigrants | Netherlands | 85.3 /100 | #140 | Excellent 16.0% |