Arab vs Polish Single Father Poverty
COMPARE
Arab
Polish
Single Father Poverty
Single Father Poverty Comparison
Arabs
Poles
16.6%
SINGLE FATHER POVERTY
12.8/ 100
METRIC RATING
211th/ 347
METRIC RANK
17.3%
SINGLE FATHER POVERTY
0.3/ 100
METRIC RATING
265th/ 347
METRIC RANK
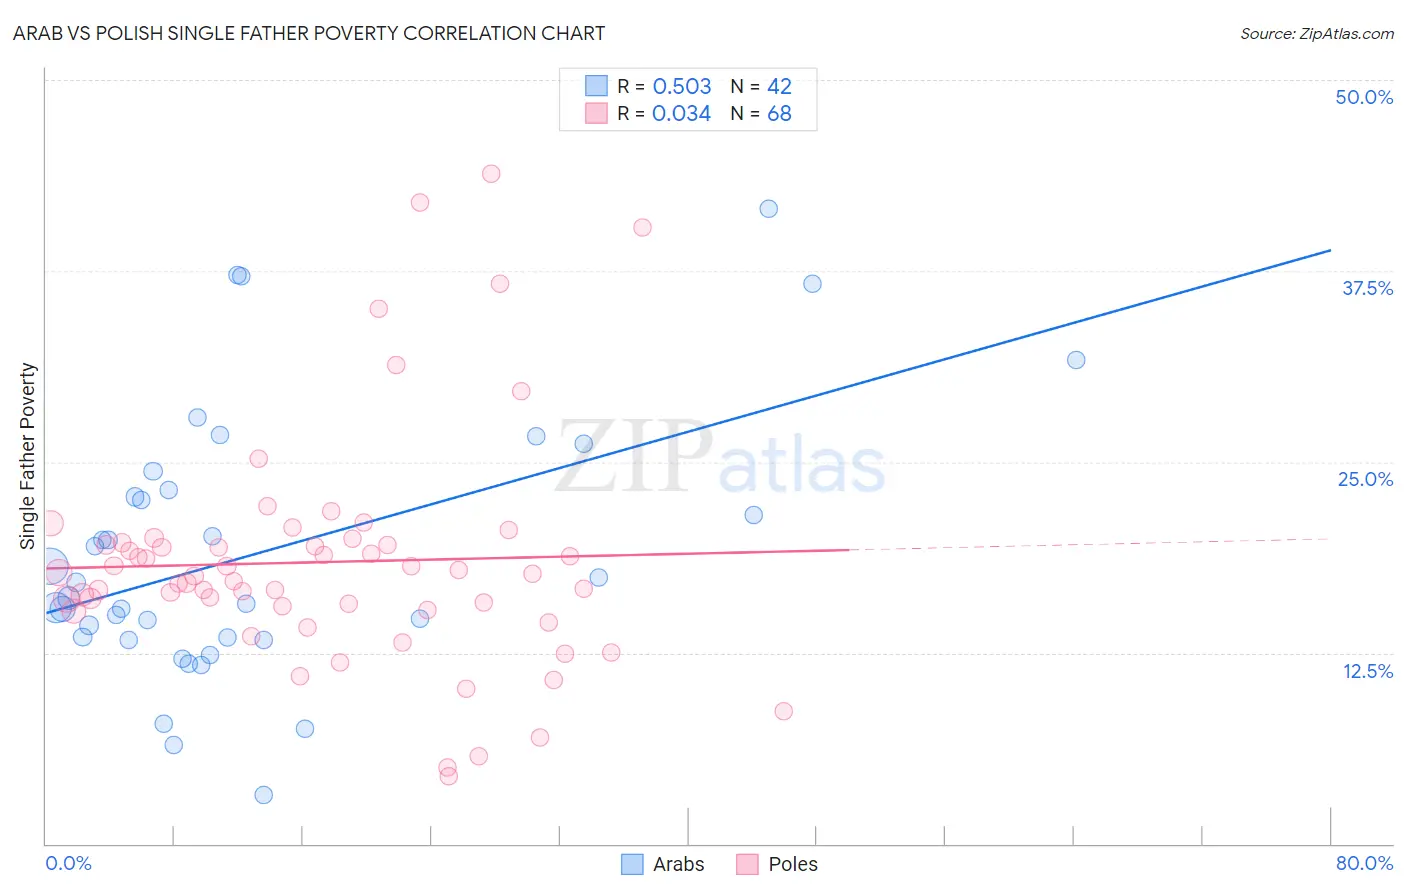
Arab vs Polish Single Father Poverty Correlation Chart
The statistical analysis conducted on geographies consisting of 369,349,186 people shows a substantial positive correlation between the proportion of Arabs and poverty level among single fathers in the United States with a correlation coefficient (R) of 0.503 and weighted average of 16.6%. Similarly, the statistical analysis conducted on geographies consisting of 402,702,262 people shows no correlation between the proportion of Poles and poverty level among single fathers in the United States with a correlation coefficient (R) of 0.034 and weighted average of 17.3%, a difference of 4.1%.
Single Father Poverty Correlation Summary
| Measurement | Arab | Polish |
| Minimum | 3.2% | 4.5% |
| Maximum | 41.6% | 43.8% |
| Range | 38.4% | 39.4% |
| Mean | 19.1% | 18.4% |
| Median | 16.6% | 17.6% |
| Interquartile 25% (IQ1) | 13.5% | 15.4% |
| Interquartile 75% (IQ3) | 23.1% | 19.6% |
| Interquartile Range (IQR) | 9.6% | 4.2% |
| Standard Deviation (Sample) | 8.7% | 7.7% |
| Standard Deviation (Population) | 8.6% | 7.6% |
Similar Demographics by Single Father Poverty
Demographics Similar to Arabs by Single Father Poverty
In terms of single father poverty, the demographic groups most similar to Arabs are Guatemalan (16.6%, a difference of 0.0%), European (16.6%, a difference of 0.030%), Immigrants from Senegal (16.6%, a difference of 0.080%), New Zealander (16.6%, a difference of 0.080%), and Eastern European (16.6%, a difference of 0.080%).
| Demographics | Rating | Rank | Single Father Poverty |
| Immigrants | Guatemala | 14.8 /100 | #204 | Poor 16.6% |
| Venezuelans | 14.3 /100 | #205 | Poor 16.6% |
| Immigrants | Senegal | 13.7 /100 | #206 | Poor 16.6% |
| New Zealanders | 13.7 /100 | #207 | Poor 16.6% |
| Eastern Europeans | 13.7 /100 | #208 | Poor 16.6% |
| Europeans | 13.2 /100 | #209 | Poor 16.6% |
| Guatemalans | 12.9 /100 | #210 | Poor 16.6% |
| Arabs | 12.8 /100 | #211 | Poor 16.6% |
| Immigrants | Southern Europe | 11.2 /100 | #212 | Poor 16.7% |
| Ghanaians | 11.0 /100 | #213 | Poor 16.7% |
| Spanish | 10.7 /100 | #214 | Poor 16.7% |
| Immigrants | Scotland | 9.6 /100 | #215 | Tragic 16.7% |
| Immigrants | England | 9.5 /100 | #216 | Tragic 16.7% |
| Cheyenne | 9.3 /100 | #217 | Tragic 16.7% |
| Immigrants | Uganda | 8.6 /100 | #218 | Tragic 16.7% |
Demographics Similar to Poles by Single Father Poverty
In terms of single father poverty, the demographic groups most similar to Poles are Slovene (17.3%, a difference of 0.0%), Jamaican (17.3%, a difference of 0.060%), Haitian (17.3%, a difference of 0.090%), Immigrants from Caribbean (17.4%, a difference of 0.19%), and Lithuanian (17.3%, a difference of 0.21%).
| Demographics | Rating | Rank | Single Father Poverty |
| Albanians | 0.7 /100 | #258 | Tragic 17.2% |
| Immigrants | Jamaica | 0.7 /100 | #259 | Tragic 17.2% |
| Spaniards | 0.6 /100 | #260 | Tragic 17.2% |
| Swiss | 0.5 /100 | #261 | Tragic 17.3% |
| Immigrants | Zaire | 0.4 /100 | #262 | Tragic 17.3% |
| Lithuanians | 0.4 /100 | #263 | Tragic 17.3% |
| Slovenes | 0.3 /100 | #264 | Tragic 17.3% |
| Poles | 0.3 /100 | #265 | Tragic 17.3% |
| Jamaicans | 0.3 /100 | #266 | Tragic 17.3% |
| Haitians | 0.3 /100 | #267 | Tragic 17.3% |
| Immigrants | Caribbean | 0.3 /100 | #268 | Tragic 17.4% |
| Slavs | 0.3 /100 | #269 | Tragic 17.4% |
| Indonesians | 0.2 /100 | #270 | Tragic 17.4% |
| French American Indians | 0.2 /100 | #271 | Tragic 17.4% |
| Barbadians | 0.1 /100 | #272 | Tragic 17.5% |