Bermudan vs Immigrants from Jordan Single Father Poverty
COMPARE
Bermudan
Immigrants from Jordan
Single Father Poverty
Single Father Poverty Comparison
Bermudans
Immigrants from Jordan
16.9%
SINGLE FATHER POVERTY
2.6/ 100
METRIC RATING
239th/ 347
METRIC RANK
16.2%
SINGLE FATHER POVERTY
66.0/ 100
METRIC RATING
156th/ 347
METRIC RANK
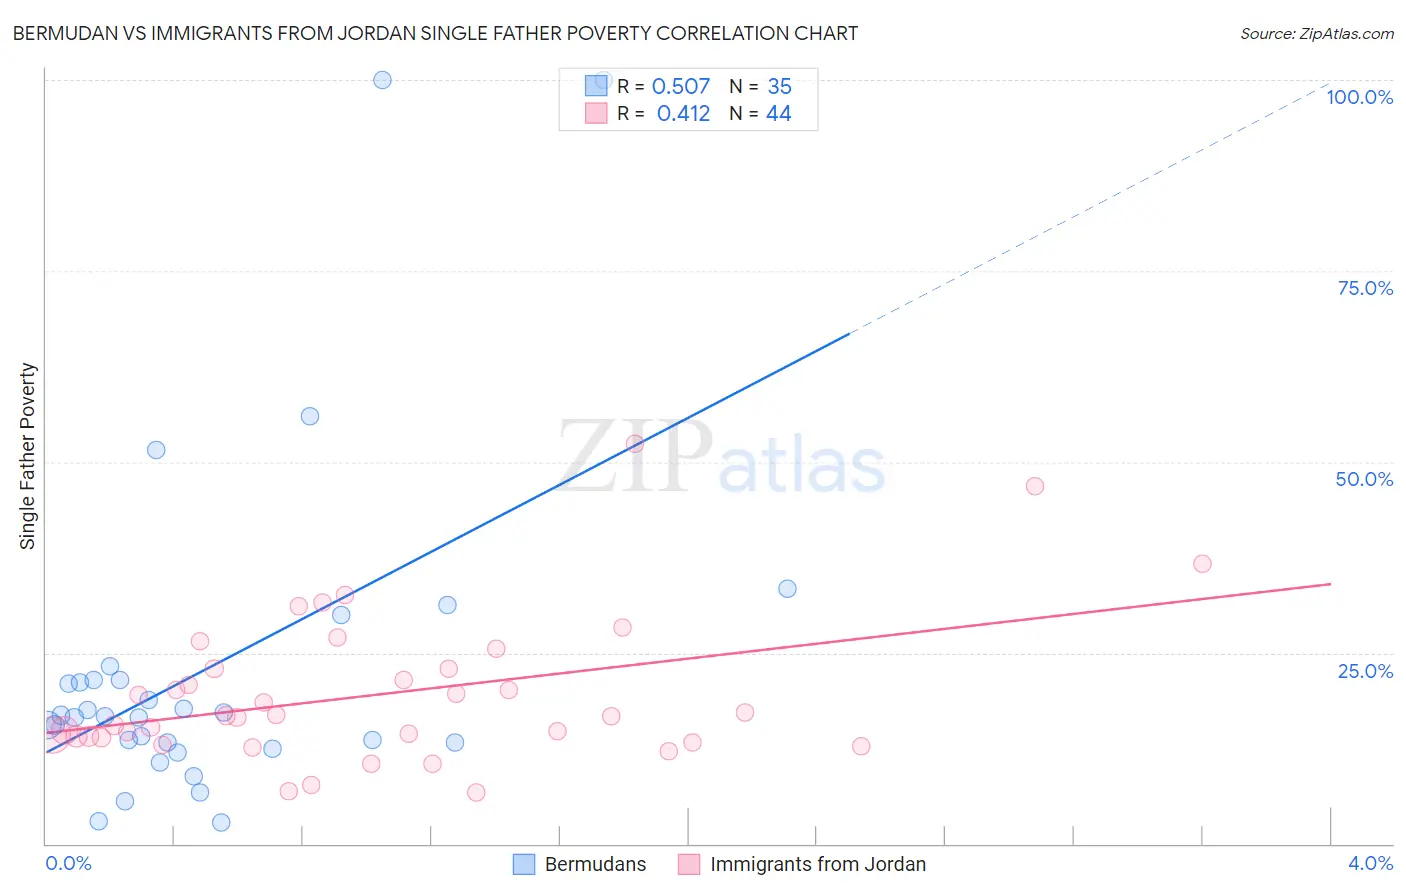
Bermudan vs Immigrants from Jordan Single Father Poverty Correlation Chart
The statistical analysis conducted on geographies consisting of 52,766,587 people shows a substantial positive correlation between the proportion of Bermudans and poverty level among single fathers in the United States with a correlation coefficient (R) of 0.507 and weighted average of 16.9%. Similarly, the statistical analysis conducted on geographies consisting of 156,428,071 people shows a moderate positive correlation between the proportion of Immigrants from Jordan and poverty level among single fathers in the United States with a correlation coefficient (R) of 0.412 and weighted average of 16.2%, a difference of 4.8%.
Single Father Poverty Correlation Summary
| Measurement | Bermudan | Immigrants from Jordan |
| Minimum | 2.7% | 6.7% |
| Maximum | 100.0% | 52.4% |
| Range | 97.3% | 45.8% |
| Mean | 23.1% | 19.5% |
| Median | 16.7% | 16.7% |
| Interquartile 25% (IQ1) | 13.2% | 13.9% |
| Interquartile 75% (IQ3) | 21.5% | 22.9% |
| Interquartile Range (IQR) | 8.2% | 8.9% |
| Standard Deviation (Sample) | 22.2% | 9.6% |
| Standard Deviation (Population) | 21.9% | 9.5% |
Similar Demographics by Single Father Poverty
Demographics Similar to Bermudans by Single Father Poverty
In terms of single father poverty, the demographic groups most similar to Bermudans are Finnish (16.9%, a difference of 0.010%), Immigrants from Saudi Arabia (16.9%, a difference of 0.020%), Immigrants from Western Europe (16.9%, a difference of 0.090%), Immigrants from Germany (16.9%, a difference of 0.090%), and Subsaharan African (16.9%, a difference of 0.090%).
| Demographics | Rating | Rank | Single Father Poverty |
| Immigrants | Grenada | 3.7 /100 | #232 | Tragic 16.9% |
| Senegalese | 3.2 /100 | #233 | Tragic 16.9% |
| Marshallese | 3.1 /100 | #234 | Tragic 16.9% |
| Immigrants | Western Europe | 2.9 /100 | #235 | Tragic 16.9% |
| Immigrants | Germany | 2.9 /100 | #236 | Tragic 16.9% |
| Sub-Saharan Africans | 2.9 /100 | #237 | Tragic 16.9% |
| Immigrants | Saudi Arabia | 2.7 /100 | #238 | Tragic 16.9% |
| Bermudans | 2.6 /100 | #239 | Tragic 16.9% |
| Finns | 2.6 /100 | #240 | Tragic 16.9% |
| Czechs | 2.3 /100 | #241 | Tragic 17.0% |
| Moroccans | 2.1 /100 | #242 | Tragic 17.0% |
| Immigrants | Cabo Verde | 1.6 /100 | #243 | Tragic 17.0% |
| Hondurans | 1.6 /100 | #244 | Tragic 17.0% |
| Trinidadians and Tobagonians | 1.5 /100 | #245 | Tragic 17.0% |
| Immigrants | Ireland | 1.4 /100 | #246 | Tragic 17.1% |
Demographics Similar to Immigrants from Jordan by Single Father Poverty
In terms of single father poverty, the demographic groups most similar to Immigrants from Jordan are Immigrants from Nicaragua (16.2%, a difference of 0.090%), Immigrants from Czechoslovakia (16.2%, a difference of 0.16%), Portuguese (16.2%, a difference of 0.18%), Mexican (16.1%, a difference of 0.21%), and Belizean (16.2%, a difference of 0.29%).
| Demographics | Rating | Rank | Single Father Poverty |
| South Africans | 75.1 /100 | #149 | Good 16.1% |
| Jordanians | 74.2 /100 | #150 | Good 16.1% |
| Immigrants | France | 73.1 /100 | #151 | Good 16.1% |
| Immigrants | Zimbabwe | 72.1 /100 | #152 | Good 16.1% |
| Immigrants | Israel | 72.0 /100 | #153 | Good 16.1% |
| Mexicans | 70.1 /100 | #154 | Good 16.1% |
| Immigrants | Nicaragua | 67.8 /100 | #155 | Good 16.2% |
| Immigrants | Jordan | 66.0 /100 | #156 | Good 16.2% |
| Immigrants | Czechoslovakia | 62.8 /100 | #157 | Good 16.2% |
| Portuguese | 62.3 /100 | #158 | Good 16.2% |
| Belizeans | 59.9 /100 | #159 | Average 16.2% |
| Immigrants | Sudan | 59.8 /100 | #160 | Average 16.2% |
| Estonians | 56.7 /100 | #161 | Average 16.2% |
| Ugandans | 55.9 /100 | #162 | Average 16.3% |
| Immigrants | Costa Rica | 55.7 /100 | #163 | Average 16.3% |