Arab vs Immigrants from Jordan Median Female Earnings
COMPARE
Arab
Immigrants from Jordan
Median Female Earnings
Median Female Earnings Comparison
Arabs
Immigrants from Jordan
$40,718
MEDIAN FEMALE EARNINGS
89.3/ 100
METRIC RATING
134th/ 347
METRIC RANK
$40,977
MEDIAN FEMALE EARNINGS
93.5/ 100
METRIC RATING
122nd/ 347
METRIC RANK
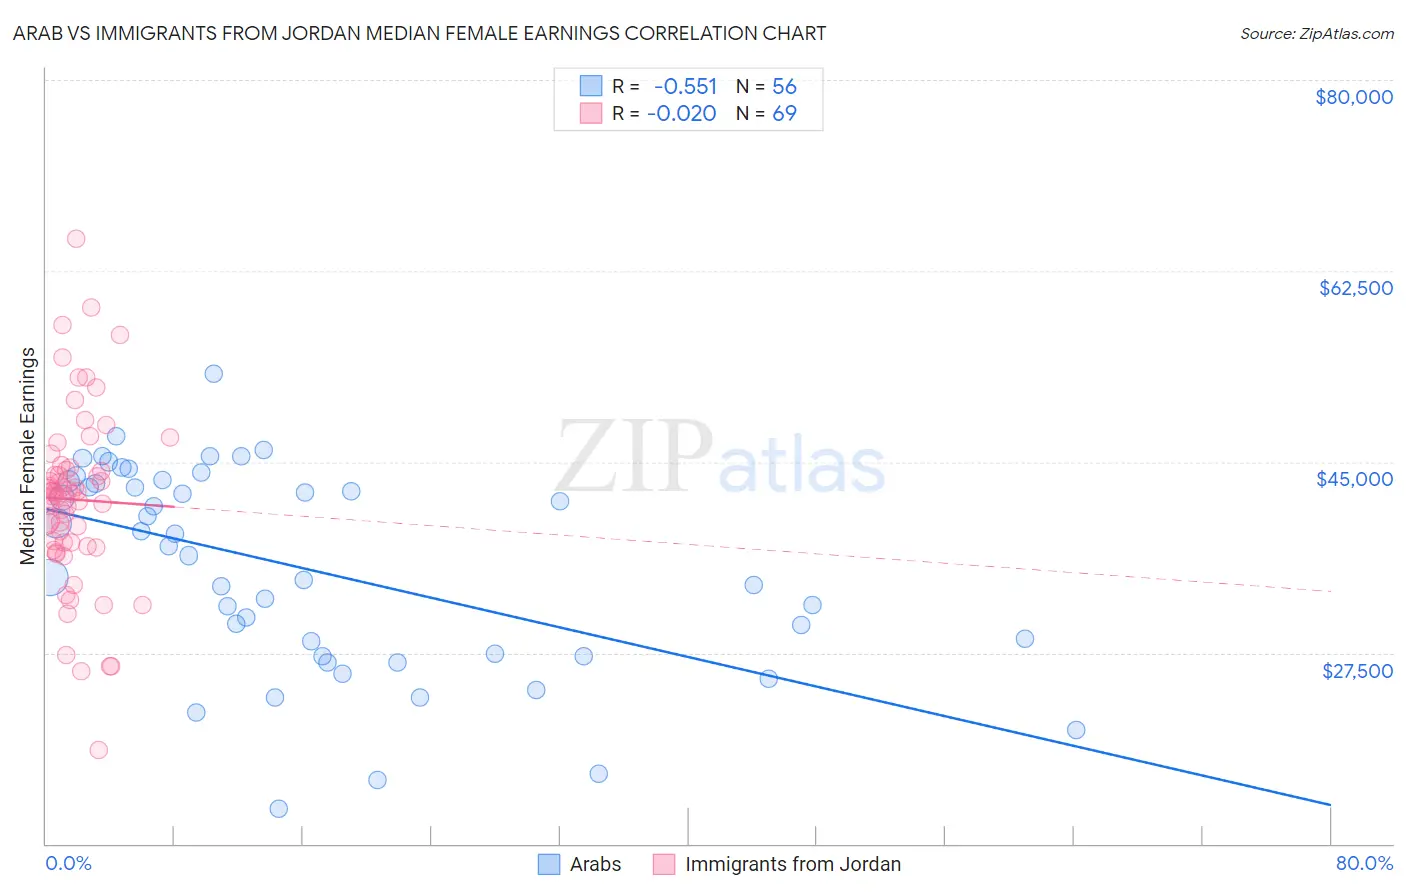
Arab vs Immigrants from Jordan Median Female Earnings Correlation Chart
The statistical analysis conducted on geographies consisting of 486,538,152 people shows a substantial negative correlation between the proportion of Arabs and median female earnings in the United States with a correlation coefficient (R) of -0.551 and weighted average of $40,718. Similarly, the statistical analysis conducted on geographies consisting of 181,274,544 people shows no correlation between the proportion of Immigrants from Jordan and median female earnings in the United States with a correlation coefficient (R) of -0.020 and weighted average of $40,977, a difference of 0.64%.
Median Female Earnings Correlation Summary
| Measurement | Arab | Immigrants from Jordan |
| Minimum | $13,173 | $18,558 |
| Maximum | $53,122 | $65,466 |
| Range | $39,949 | $46,908 |
| Mean | $35,183 | $41,547 |
| Median | $36,815 | $42,113 |
| Interquartile 25% (IQ1) | $27,287 | $37,412 |
| Interquartile 75% (IQ3) | $43,150 | $44,413 |
| Interquartile Range (IQR) | $15,863 | $7,001 |
| Standard Deviation (Sample) | $9,334 | $8,068 |
| Standard Deviation (Population) | $9,250 | $8,010 |
Demographics Similar to Arabs and Immigrants from Jordan by Median Female Earnings
In terms of median female earnings, the demographic groups most similar to Arabs are Syrian ($40,727, a difference of 0.020%), Immigrants from Nepal ($40,704, a difference of 0.030%), Immigrants from Uganda ($40,739, a difference of 0.050%), Chilean ($40,757, a difference of 0.10%), and Immigrants from Guyana ($40,773, a difference of 0.14%). Similarly, the demographic groups most similar to Immigrants from Jordan are Guyanese ($40,973, a difference of 0.010%), Croatian ($40,993, a difference of 0.040%), Trinidadian and Tobagonian ($40,958, a difference of 0.050%), Austrian ($40,923, a difference of 0.13%), and Immigrants from Kuwait ($41,055, a difference of 0.19%).
| Demographics | Rating | Rank | Median Female Earnings |
| Immigrants | Lebanon | 95.6 /100 | #118 | Exceptional $41,183 |
| Immigrants | Philippines | 95.0 /100 | #119 | Exceptional $41,114 |
| Immigrants | Kuwait | 94.4 /100 | #120 | Exceptional $41,055 |
| Croatians | 93.7 /100 | #121 | Exceptional $40,993 |
| Immigrants | Jordan | 93.5 /100 | #122 | Exceptional $40,977 |
| Guyanese | 93.4 /100 | #123 | Exceptional $40,973 |
| Trinidadians and Tobagonians | 93.2 /100 | #124 | Exceptional $40,958 |
| Austrians | 92.7 /100 | #125 | Exceptional $40,923 |
| Immigrants | Trinidad and Tobago | 92.3 /100 | #126 | Exceptional $40,895 |
| Ugandans | 92.2 /100 | #127 | Exceptional $40,889 |
| Carpatho Rusyns | 91.2 /100 | #128 | Exceptional $40,825 |
| Zimbabweans | 90.8 /100 | #129 | Exceptional $40,798 |
| Immigrants | Guyana | 90.3 /100 | #130 | Exceptional $40,773 |
| Chileans | 90.0 /100 | #131 | Exceptional $40,757 |
| Immigrants | Uganda | 89.7 /100 | #132 | Excellent $40,739 |
| Syrians | 89.5 /100 | #133 | Excellent $40,727 |
| Arabs | 89.3 /100 | #134 | Excellent $40,718 |
| Immigrants | Nepal | 89.0 /100 | #135 | Excellent $40,704 |
| Immigrants | Eastern Africa | 87.7 /100 | #136 | Excellent $40,644 |
| Pakistanis | 86.6 /100 | #137 | Excellent $40,596 |
| Taiwanese | 86.1 /100 | #138 | Excellent $40,576 |