Danish vs Immigrants from Jordan Single Father Poverty
COMPARE
Danish
Immigrants from Jordan
Single Father Poverty
Single Father Poverty Comparison
Danes
Immigrants from Jordan
15.8%
SINGLE FATHER POVERTY
94.5/ 100
METRIC RATING
113th/ 347
METRIC RANK
16.2%
SINGLE FATHER POVERTY
66.0/ 100
METRIC RATING
156th/ 347
METRIC RANK
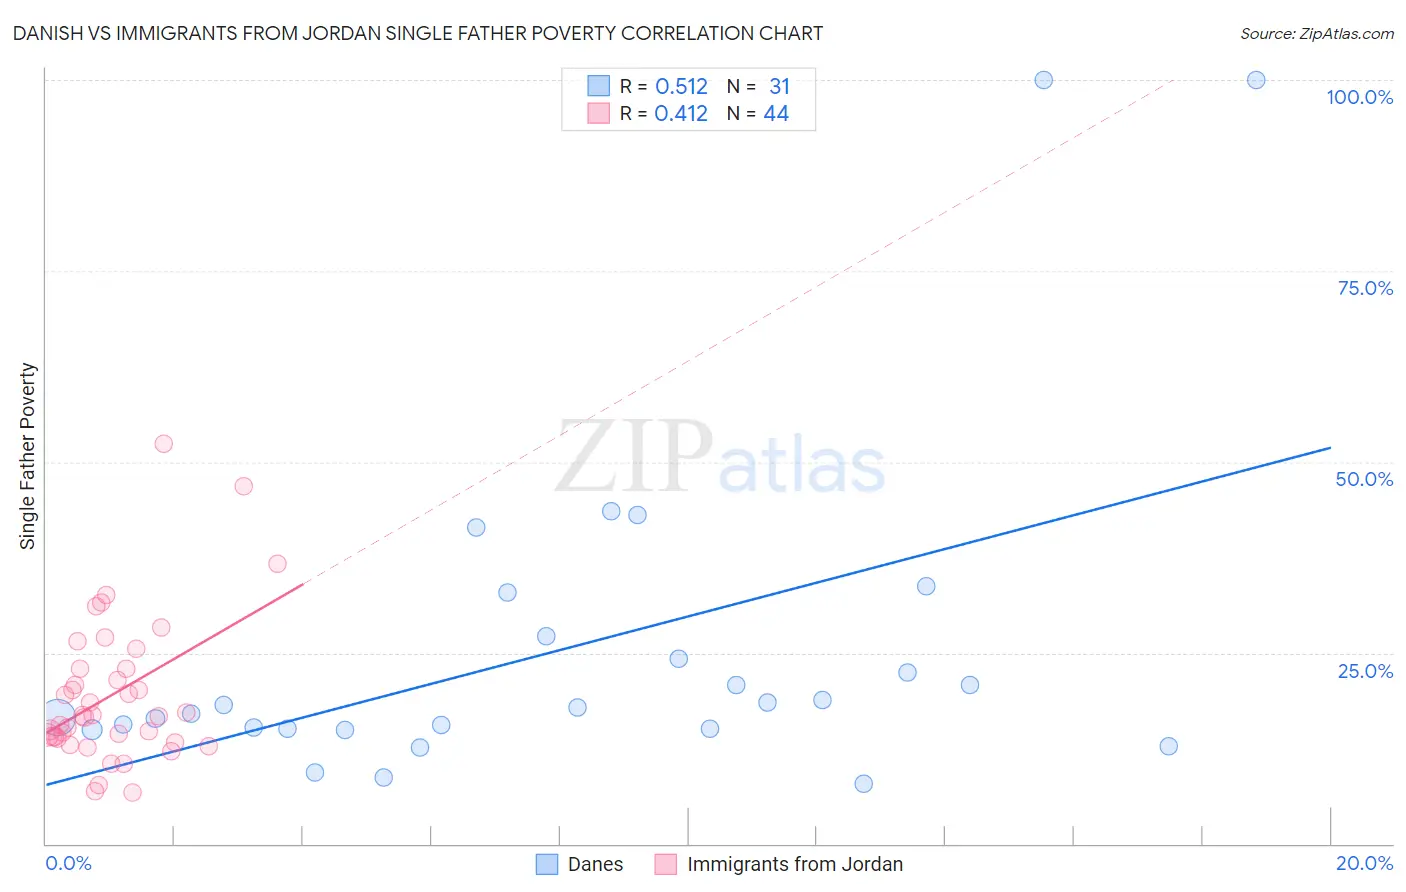
Danish vs Immigrants from Jordan Single Father Poverty Correlation Chart
The statistical analysis conducted on geographies consisting of 352,960,899 people shows a substantial positive correlation between the proportion of Danes and poverty level among single fathers in the United States with a correlation coefficient (R) of 0.512 and weighted average of 15.8%. Similarly, the statistical analysis conducted on geographies consisting of 156,428,071 people shows a moderate positive correlation between the proportion of Immigrants from Jordan and poverty level among single fathers in the United States with a correlation coefficient (R) of 0.412 and weighted average of 16.2%, a difference of 2.5%.
Single Father Poverty Correlation Summary
| Measurement | Danish | Immigrants from Jordan |
| Minimum | 7.9% | 6.7% |
| Maximum | 100.0% | 52.4% |
| Range | 92.1% | 45.8% |
| Mean | 25.5% | 19.5% |
| Median | 17.9% | 16.7% |
| Interquartile 25% (IQ1) | 15.1% | 13.9% |
| Interquartile 75% (IQ3) | 27.1% | 22.9% |
| Interquartile Range (IQR) | 12.0% | 8.9% |
| Standard Deviation (Sample) | 22.0% | 9.6% |
| Standard Deviation (Population) | 21.6% | 9.5% |
Similar Demographics by Single Father Poverty
Demographics Similar to Danes by Single Father Poverty
In terms of single father poverty, the demographic groups most similar to Danes are Argentinean (15.8%, a difference of 0.020%), Immigrants from Latvia (15.8%, a difference of 0.040%), Bulgarian (15.8%, a difference of 0.080%), Immigrants from Africa (15.8%, a difference of 0.13%), and Turkish (15.8%, a difference of 0.14%).
| Demographics | Rating | Rank | Single Father Poverty |
| Immigrants | Poland | 95.8 /100 | #106 | Exceptional 15.7% |
| Native Hawaiians | 95.8 /100 | #107 | Exceptional 15.7% |
| Pakistanis | 95.7 /100 | #108 | Exceptional 15.7% |
| Turks | 95.1 /100 | #109 | Exceptional 15.8% |
| Immigrants | Africa | 95.1 /100 | #110 | Exceptional 15.8% |
| Bulgarians | 94.8 /100 | #111 | Exceptional 15.8% |
| Immigrants | Latvia | 94.7 /100 | #112 | Exceptional 15.8% |
| Danes | 94.5 /100 | #113 | Exceptional 15.8% |
| Argentineans | 94.4 /100 | #114 | Exceptional 15.8% |
| Immigrants | Thailand | 93.6 /100 | #115 | Exceptional 15.8% |
| Immigrants | Argentina | 92.8 /100 | #116 | Exceptional 15.8% |
| Immigrants | Colombia | 92.6 /100 | #117 | Exceptional 15.8% |
| Immigrants | Eastern Europe | 92.5 /100 | #118 | Exceptional 15.8% |
| Immigrants | Belarus | 92.4 /100 | #119 | Exceptional 15.8% |
| Uruguayans | 92.1 /100 | #120 | Exceptional 15.9% |
Demographics Similar to Immigrants from Jordan by Single Father Poverty
In terms of single father poverty, the demographic groups most similar to Immigrants from Jordan are Immigrants from Nicaragua (16.2%, a difference of 0.090%), Immigrants from Czechoslovakia (16.2%, a difference of 0.16%), Portuguese (16.2%, a difference of 0.18%), Mexican (16.1%, a difference of 0.21%), and Belizean (16.2%, a difference of 0.29%).
| Demographics | Rating | Rank | Single Father Poverty |
| South Africans | 75.1 /100 | #149 | Good 16.1% |
| Jordanians | 74.2 /100 | #150 | Good 16.1% |
| Immigrants | France | 73.1 /100 | #151 | Good 16.1% |
| Immigrants | Zimbabwe | 72.1 /100 | #152 | Good 16.1% |
| Immigrants | Israel | 72.0 /100 | #153 | Good 16.1% |
| Mexicans | 70.1 /100 | #154 | Good 16.1% |
| Immigrants | Nicaragua | 67.8 /100 | #155 | Good 16.2% |
| Immigrants | Jordan | 66.0 /100 | #156 | Good 16.2% |
| Immigrants | Czechoslovakia | 62.8 /100 | #157 | Good 16.2% |
| Portuguese | 62.3 /100 | #158 | Good 16.2% |
| Belizeans | 59.9 /100 | #159 | Average 16.2% |
| Immigrants | Sudan | 59.8 /100 | #160 | Average 16.2% |
| Estonians | 56.7 /100 | #161 | Average 16.2% |
| Ugandans | 55.9 /100 | #162 | Average 16.3% |
| Immigrants | Costa Rica | 55.7 /100 | #163 | Average 16.3% |