Apache vs Marshallese Child Poverty Under the Age of 5
COMPARE
Apache
Marshallese
Child Poverty Under the Age of 5
Child Poverty Under the Age of 5 Comparison
Apache
Marshallese
25.0%
CHILD POVERTY UNDER THE AGE OF 5
0.0/ 100
METRIC RATING
332nd/ 347
METRIC RANK
19.7%
CHILD POVERTY UNDER THE AGE OF 5
0.4/ 100
METRIC RATING
248th/ 347
METRIC RANK
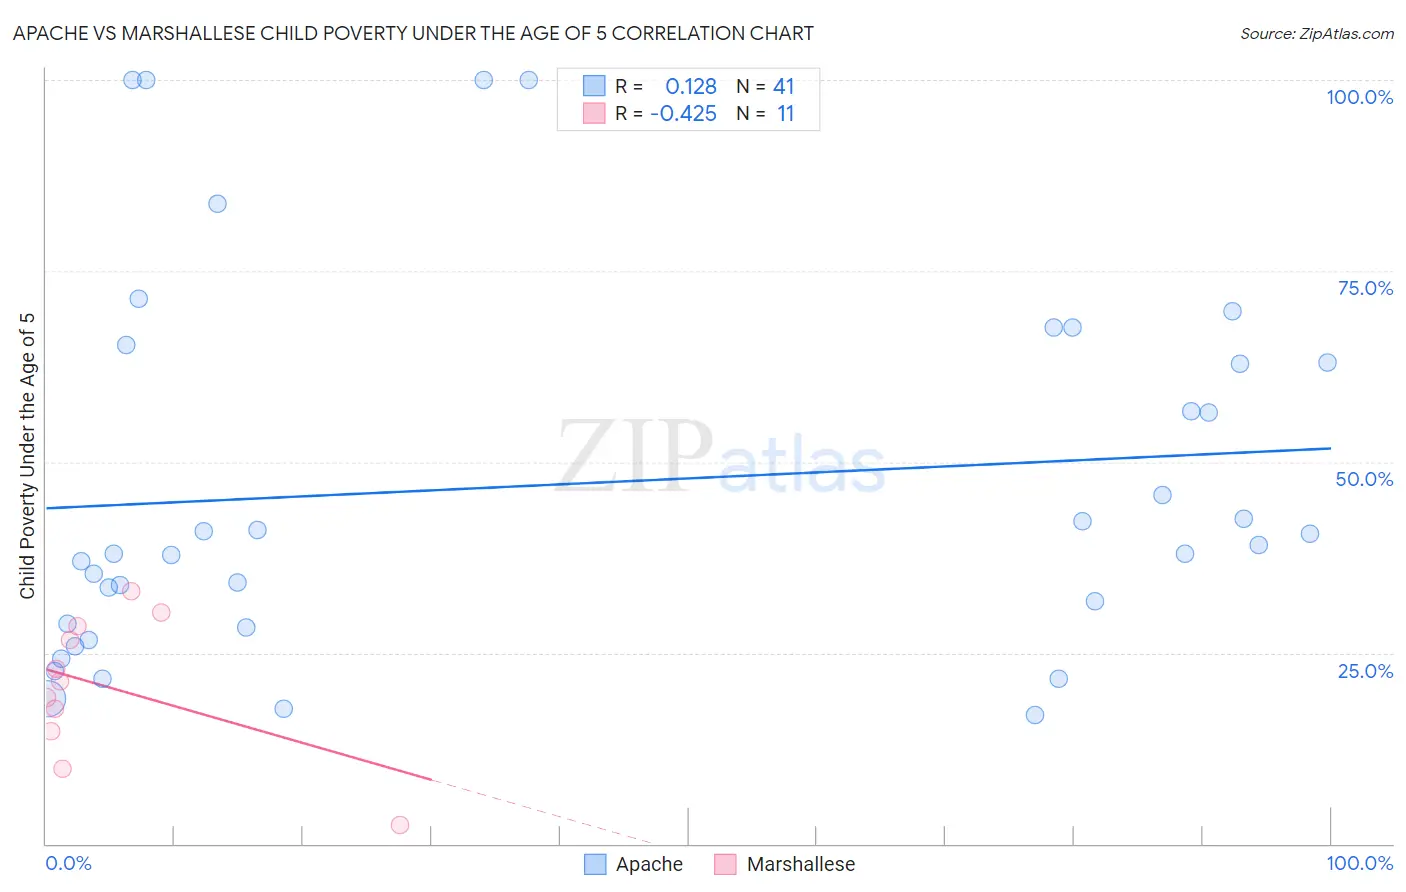
Apache vs Marshallese Child Poverty Under the Age of 5 Correlation Chart
The statistical analysis conducted on geographies consisting of 227,703,796 people shows a poor positive correlation between the proportion of Apache and poverty level among children under the age of 5 in the United States with a correlation coefficient (R) of 0.128 and weighted average of 25.0%. Similarly, the statistical analysis conducted on geographies consisting of 14,701,855 people shows a moderate negative correlation between the proportion of Marshallese and poverty level among children under the age of 5 in the United States with a correlation coefficient (R) of -0.425 and weighted average of 19.7%, a difference of 26.7%.
Child Poverty Under the Age of 5 Correlation Summary
| Measurement | Apache | Marshallese |
| Minimum | 16.9% | 2.4% |
| Maximum | 100.0% | 33.0% |
| Range | 83.1% | 30.6% |
| Mean | 47.1% | 20.6% |
| Median | 39.2% | 21.2% |
| Interquartile 25% (IQ1) | 28.6% | 14.8% |
| Interquartile 75% (IQ3) | 64.1% | 28.6% |
| Interquartile Range (IQR) | 35.5% | 13.8% |
| Standard Deviation (Sample) | 24.2% | 9.2% |
| Standard Deviation (Population) | 23.9% | 8.8% |
Similar Demographics by Child Poverty Under the Age of 5
Demographics Similar to Apache by Child Poverty Under the Age of 5
In terms of child poverty under the age of 5, the demographic groups most similar to Apache are Kiowa (24.5%, a difference of 2.2%), Native/Alaskan (25.6%, a difference of 2.2%), Black/African American (25.7%, a difference of 2.8%), Colville (25.7%, a difference of 2.8%), and Creek (24.2%, a difference of 3.2%).
| Demographics | Rating | Rank | Child Poverty Under the Age of 5 |
| Immigrants | Congo | 0.0 /100 | #325 | Tragic 23.9% |
| Central American Indians | 0.0 /100 | #326 | Tragic 23.9% |
| Dominicans | 0.0 /100 | #327 | Tragic 24.0% |
| Immigrants | Dominican Republic | 0.0 /100 | #328 | Tragic 24.1% |
| Cajuns | 0.0 /100 | #329 | Tragic 24.1% |
| Creek | 0.0 /100 | #330 | Tragic 24.2% |
| Kiowa | 0.0 /100 | #331 | Tragic 24.5% |
| Apache | 0.0 /100 | #332 | Tragic 25.0% |
| Natives/Alaskans | 0.0 /100 | #333 | Tragic 25.6% |
| Blacks/African Americans | 0.0 /100 | #334 | Tragic 25.7% |
| Colville | 0.0 /100 | #335 | Tragic 25.7% |
| Sioux | 0.0 /100 | #336 | Tragic 26.9% |
| Pima | 0.0 /100 | #337 | Tragic 27.4% |
| Hopi | 0.0 /100 | #338 | Tragic 27.7% |
| Yup'ik | 0.0 /100 | #339 | Tragic 27.7% |
Demographics Similar to Marshallese by Child Poverty Under the Age of 5
In terms of child poverty under the age of 5, the demographic groups most similar to Marshallese are Guyanese (19.7%, a difference of 0.010%), Immigrants from Middle Africa (19.7%, a difference of 0.020%), Nonimmigrants (19.7%, a difference of 0.070%), Cree (19.7%, a difference of 0.17%), and Pennsylvania German (19.8%, a difference of 0.24%).
| Demographics | Rating | Rank | Child Poverty Under the Age of 5 |
| Alaska Natives | 0.5 /100 | #241 | Tragic 19.6% |
| Immigrants | Guyana | 0.5 /100 | #242 | Tragic 19.6% |
| Osage | 0.5 /100 | #243 | Tragic 19.6% |
| Immigrants | Ghana | 0.5 /100 | #244 | Tragic 19.6% |
| Immigrants | Western Africa | 0.4 /100 | #245 | Tragic 19.7% |
| Cree | 0.4 /100 | #246 | Tragic 19.7% |
| Guyanese | 0.4 /100 | #247 | Tragic 19.7% |
| Marshallese | 0.4 /100 | #248 | Tragic 19.7% |
| Immigrants | Middle Africa | 0.4 /100 | #249 | Tragic 19.7% |
| Immigrants | Nonimmigrants | 0.4 /100 | #250 | Tragic 19.7% |
| Pennsylvania Germans | 0.3 /100 | #251 | Tragic 19.8% |
| Immigrants | Nicaragua | 0.3 /100 | #252 | Tragic 19.8% |
| Mexican American Indians | 0.3 /100 | #253 | Tragic 19.9% |
| Fijians | 0.3 /100 | #254 | Tragic 19.9% |
| Immigrants | Cuba | 0.2 /100 | #255 | Tragic 19.9% |