Immigrants from Europe vs Marshallese Child Poverty Under the Age of 5
COMPARE
Immigrants from Europe
Marshallese
Child Poverty Under the Age of 5
Child Poverty Under the Age of 5 Comparison
Immigrants from Europe
Marshallese
15.1%
CHILD POVERTY UNDER THE AGE OF 5
99.1/ 100
METRIC RATING
63rd/ 347
METRIC RANK
19.7%
CHILD POVERTY UNDER THE AGE OF 5
0.4/ 100
METRIC RATING
248th/ 347
METRIC RANK
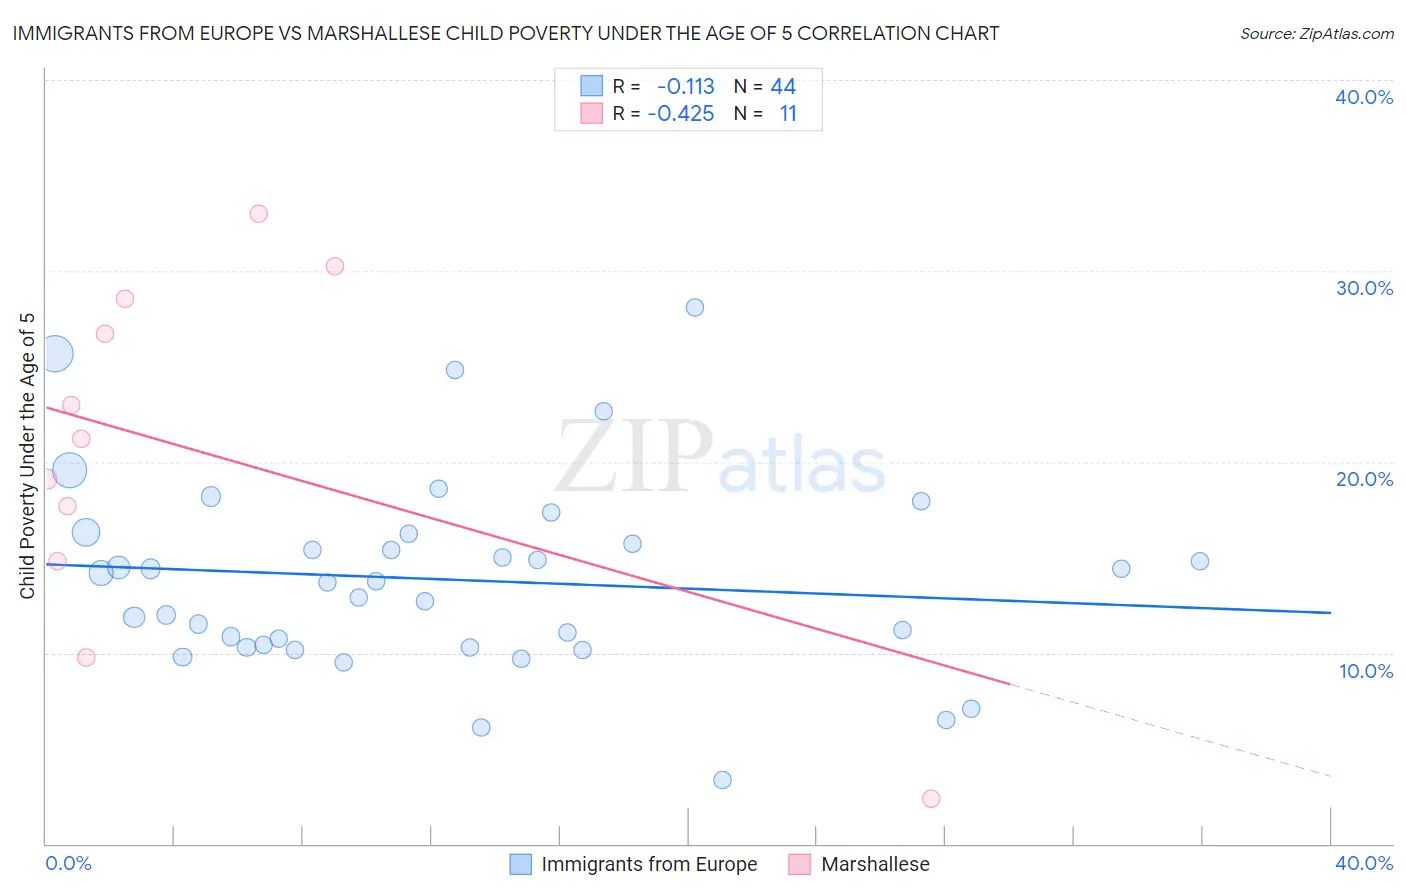
Immigrants from Europe vs Marshallese Child Poverty Under the Age of 5 Correlation Chart
The statistical analysis conducted on geographies consisting of 511,883,823 people shows a poor negative correlation between the proportion of Immigrants from Europe and poverty level among children under the age of 5 in the United States with a correlation coefficient (R) of -0.113 and weighted average of 15.1%. Similarly, the statistical analysis conducted on geographies consisting of 14,701,855 people shows a moderate negative correlation between the proportion of Marshallese and poverty level among children under the age of 5 in the United States with a correlation coefficient (R) of -0.425 and weighted average of 19.7%, a difference of 30.2%.
Child Poverty Under the Age of 5 Correlation Summary
| Measurement | Immigrants from Europe | Marshallese |
| Minimum | 3.3% | 2.4% |
| Maximum | 28.1% | 33.0% |
| Range | 24.7% | 30.6% |
| Mean | 13.8% | 20.6% |
| Median | 13.7% | 21.2% |
| Interquartile 25% (IQ1) | 10.4% | 14.8% |
| Interquartile 75% (IQ3) | 16.0% | 28.6% |
| Interquartile Range (IQR) | 5.6% | 13.8% |
| Standard Deviation (Sample) | 5.1% | 9.2% |
| Standard Deviation (Population) | 5.0% | 8.8% |
Similar Demographics by Child Poverty Under the Age of 5
Demographics Similar to Immigrants from Europe by Child Poverty Under the Age of 5
In terms of child poverty under the age of 5, the demographic groups most similar to Immigrants from Europe are Immigrants from Romania (15.2%, a difference of 0.020%), Immigrants from Fiji (15.2%, a difference of 0.050%), Immigrants from Eastern Europe (15.1%, a difference of 0.13%), Immigrants from Scotland (15.2%, a difference of 0.16%), and Greek (15.2%, a difference of 0.23%).
| Demographics | Rating | Rank | Child Poverty Under the Age of 5 |
| Immigrants | Pakistan | 99.4 /100 | #56 | Exceptional 14.9% |
| Egyptians | 99.4 /100 | #57 | Exceptional 14.9% |
| Swedes | 99.4 /100 | #58 | Exceptional 15.0% |
| Paraguayans | 99.4 /100 | #59 | Exceptional 15.0% |
| Immigrants | Russia | 99.3 /100 | #60 | Exceptional 15.0% |
| Immigrants | Poland | 99.1 /100 | #61 | Exceptional 15.1% |
| Immigrants | Eastern Europe | 99.1 /100 | #62 | Exceptional 15.1% |
| Immigrants | Europe | 99.1 /100 | #63 | Exceptional 15.1% |
| Immigrants | Romania | 99.1 /100 | #64 | Exceptional 15.2% |
| Immigrants | Fiji | 99.0 /100 | #65 | Exceptional 15.2% |
| Immigrants | Scotland | 99.0 /100 | #66 | Exceptional 15.2% |
| Greeks | 99.0 /100 | #67 | Exceptional 15.2% |
| Zimbabweans | 99.0 /100 | #68 | Exceptional 15.2% |
| Lithuanians | 99.0 /100 | #69 | Exceptional 15.2% |
| Immigrants | Belgium | 98.8 /100 | #70 | Exceptional 15.3% |
Demographics Similar to Marshallese by Child Poverty Under the Age of 5
In terms of child poverty under the age of 5, the demographic groups most similar to Marshallese are Guyanese (19.7%, a difference of 0.010%), Immigrants from Middle Africa (19.7%, a difference of 0.020%), Nonimmigrants (19.7%, a difference of 0.070%), Cree (19.7%, a difference of 0.17%), and Pennsylvania German (19.8%, a difference of 0.24%).
| Demographics | Rating | Rank | Child Poverty Under the Age of 5 |
| Alaska Natives | 0.5 /100 | #241 | Tragic 19.6% |
| Immigrants | Guyana | 0.5 /100 | #242 | Tragic 19.6% |
| Osage | 0.5 /100 | #243 | Tragic 19.6% |
| Immigrants | Ghana | 0.5 /100 | #244 | Tragic 19.6% |
| Immigrants | Western Africa | 0.4 /100 | #245 | Tragic 19.7% |
| Cree | 0.4 /100 | #246 | Tragic 19.7% |
| Guyanese | 0.4 /100 | #247 | Tragic 19.7% |
| Marshallese | 0.4 /100 | #248 | Tragic 19.7% |
| Immigrants | Middle Africa | 0.4 /100 | #249 | Tragic 19.7% |
| Immigrants | Nonimmigrants | 0.4 /100 | #250 | Tragic 19.7% |
| Pennsylvania Germans | 0.3 /100 | #251 | Tragic 19.8% |
| Immigrants | Nicaragua | 0.3 /100 | #252 | Tragic 19.8% |
| Mexican American Indians | 0.3 /100 | #253 | Tragic 19.9% |
| Fijians | 0.3 /100 | #254 | Tragic 19.9% |
| Immigrants | Cuba | 0.2 /100 | #255 | Tragic 19.9% |