Apache vs Polish Child Poverty Under the Age of 5
COMPARE
Apache
Polish
Child Poverty Under the Age of 5
Child Poverty Under the Age of 5 Comparison
Apache
Poles
25.0%
CHILD POVERTY UNDER THE AGE OF 5
0.0/ 100
METRIC RATING
332nd/ 347
METRIC RANK
15.7%
CHILD POVERTY UNDER THE AGE OF 5
97.2/ 100
METRIC RATING
91st/ 347
METRIC RANK
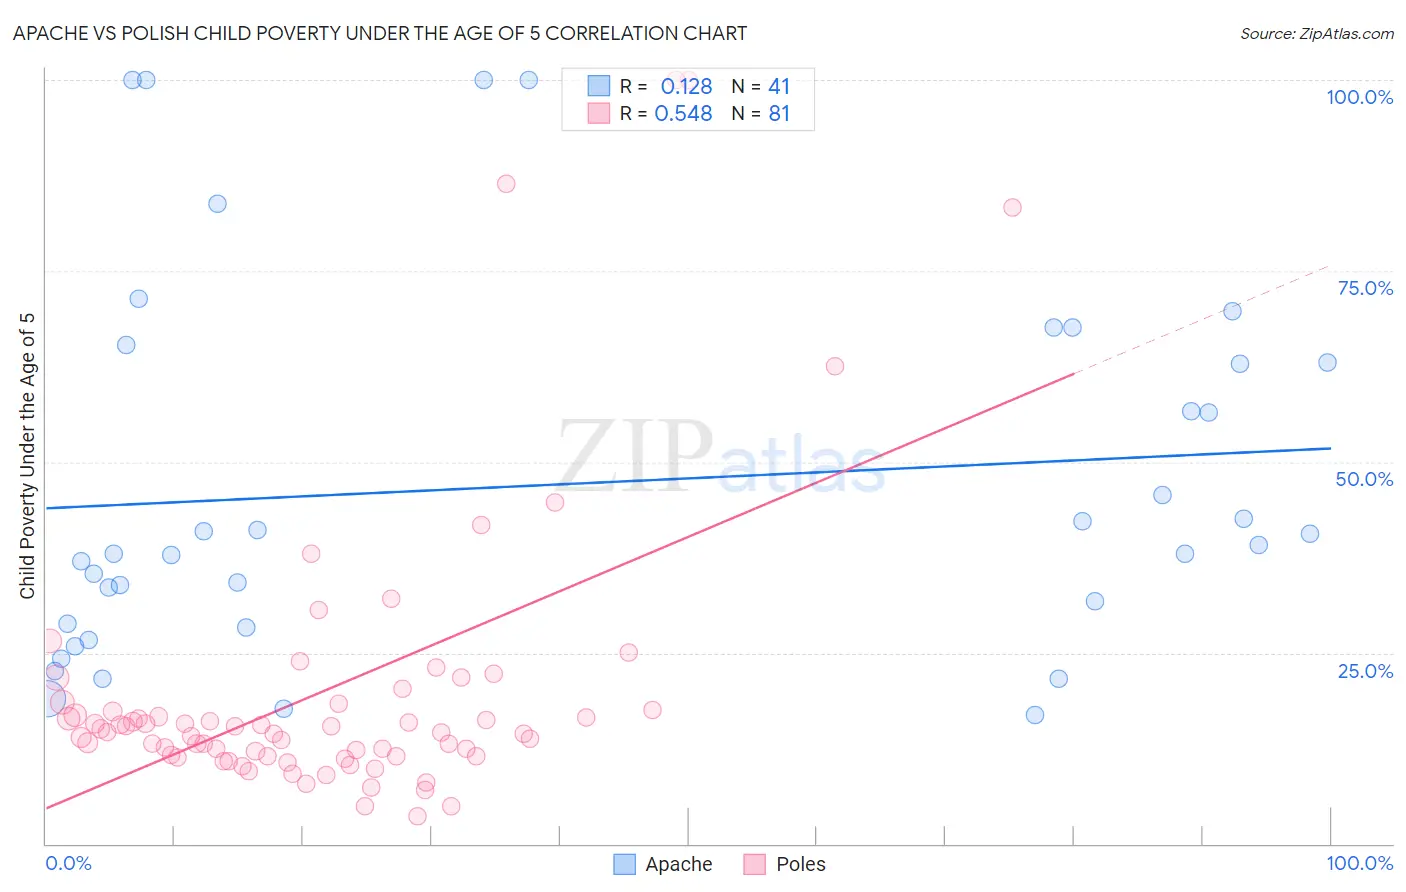
Apache vs Polish Child Poverty Under the Age of 5 Correlation Chart
The statistical analysis conducted on geographies consisting of 227,703,796 people shows a poor positive correlation between the proportion of Apache and poverty level among children under the age of 5 in the United States with a correlation coefficient (R) of 0.128 and weighted average of 25.0%. Similarly, the statistical analysis conducted on geographies consisting of 520,801,927 people shows a substantial positive correlation between the proportion of Poles and poverty level among children under the age of 5 in the United States with a correlation coefficient (R) of 0.548 and weighted average of 15.7%, a difference of 59.7%.
Child Poverty Under the Age of 5 Correlation Summary
| Measurement | Apache | Polish |
| Minimum | 16.9% | 3.7% |
| Maximum | 100.0% | 100.0% |
| Range | 83.1% | 96.3% |
| Mean | 47.1% | 20.0% |
| Median | 39.2% | 14.6% |
| Interquartile 25% (IQ1) | 28.6% | 11.5% |
| Interquartile 75% (IQ3) | 64.1% | 17.9% |
| Interquartile Range (IQR) | 35.5% | 6.4% |
| Standard Deviation (Sample) | 24.2% | 18.9% |
| Standard Deviation (Population) | 23.9% | 18.8% |
Similar Demographics by Child Poverty Under the Age of 5
Demographics Similar to Apache by Child Poverty Under the Age of 5
In terms of child poverty under the age of 5, the demographic groups most similar to Apache are Kiowa (24.5%, a difference of 2.2%), Native/Alaskan (25.6%, a difference of 2.2%), Black/African American (25.7%, a difference of 2.8%), Colville (25.7%, a difference of 2.8%), and Creek (24.2%, a difference of 3.2%).
| Demographics | Rating | Rank | Child Poverty Under the Age of 5 |
| Immigrants | Congo | 0.0 /100 | #325 | Tragic 23.9% |
| Central American Indians | 0.0 /100 | #326 | Tragic 23.9% |
| Dominicans | 0.0 /100 | #327 | Tragic 24.0% |
| Immigrants | Dominican Republic | 0.0 /100 | #328 | Tragic 24.1% |
| Cajuns | 0.0 /100 | #329 | Tragic 24.1% |
| Creek | 0.0 /100 | #330 | Tragic 24.2% |
| Kiowa | 0.0 /100 | #331 | Tragic 24.5% |
| Apache | 0.0 /100 | #332 | Tragic 25.0% |
| Natives/Alaskans | 0.0 /100 | #333 | Tragic 25.6% |
| Blacks/African Americans | 0.0 /100 | #334 | Tragic 25.7% |
| Colville | 0.0 /100 | #335 | Tragic 25.7% |
| Sioux | 0.0 /100 | #336 | Tragic 26.9% |
| Pima | 0.0 /100 | #337 | Tragic 27.4% |
| Hopi | 0.0 /100 | #338 | Tragic 27.7% |
| Yup'ik | 0.0 /100 | #339 | Tragic 27.7% |
Demographics Similar to Poles by Child Poverty Under the Age of 5
In terms of child poverty under the age of 5, the demographic groups most similar to Poles are Scandinavian (15.7%, a difference of 0.060%), Ukrainian (15.7%, a difference of 0.090%), Immigrants from South Eastern Asia (15.7%, a difference of 0.10%), Immigrants from Croatia (15.6%, a difference of 0.11%), and Immigrants from France (15.6%, a difference of 0.11%).
| Demographics | Rating | Rank | Child Poverty Under the Age of 5 |
| Immigrants | Netherlands | 97.6 /100 | #84 | Exceptional 15.6% |
| Immigrants | Latvia | 97.4 /100 | #85 | Exceptional 15.6% |
| Immigrants | Malaysia | 97.4 /100 | #86 | Exceptional 15.6% |
| Immigrants | Vietnam | 97.4 /100 | #87 | Exceptional 15.6% |
| Jordanians | 97.3 /100 | #88 | Exceptional 15.6% |
| Immigrants | Croatia | 97.3 /100 | #89 | Exceptional 15.6% |
| Immigrants | France | 97.3 /100 | #90 | Exceptional 15.6% |
| Poles | 97.2 /100 | #91 | Exceptional 15.7% |
| Scandinavians | 97.1 /100 | #92 | Exceptional 15.7% |
| Ukrainians | 97.1 /100 | #93 | Exceptional 15.7% |
| Immigrants | South Eastern Asia | 97.1 /100 | #94 | Exceptional 15.7% |
| Immigrants | Switzerland | 96.4 /100 | #95 | Exceptional 15.8% |
| Immigrants | Kazakhstan | 96.2 /100 | #96 | Exceptional 15.8% |
| Macedonians | 96.2 /100 | #97 | Exceptional 15.8% |
| Immigrants | South Africa | 96.1 /100 | #98 | Exceptional 15.8% |