Apache vs Marshallese Associate's Degree
COMPARE
Apache
Marshallese
Associate's Degree
Associate's Degree Comparison
Apache
Marshallese
36.2%
ASSOCIATE'S DEGREE
0.0/ 100
METRIC RATING
330th/ 347
METRIC RANK
41.6%
ASSOCIATE'S DEGREE
0.4/ 100
METRIC RATING
260th/ 347
METRIC RANK
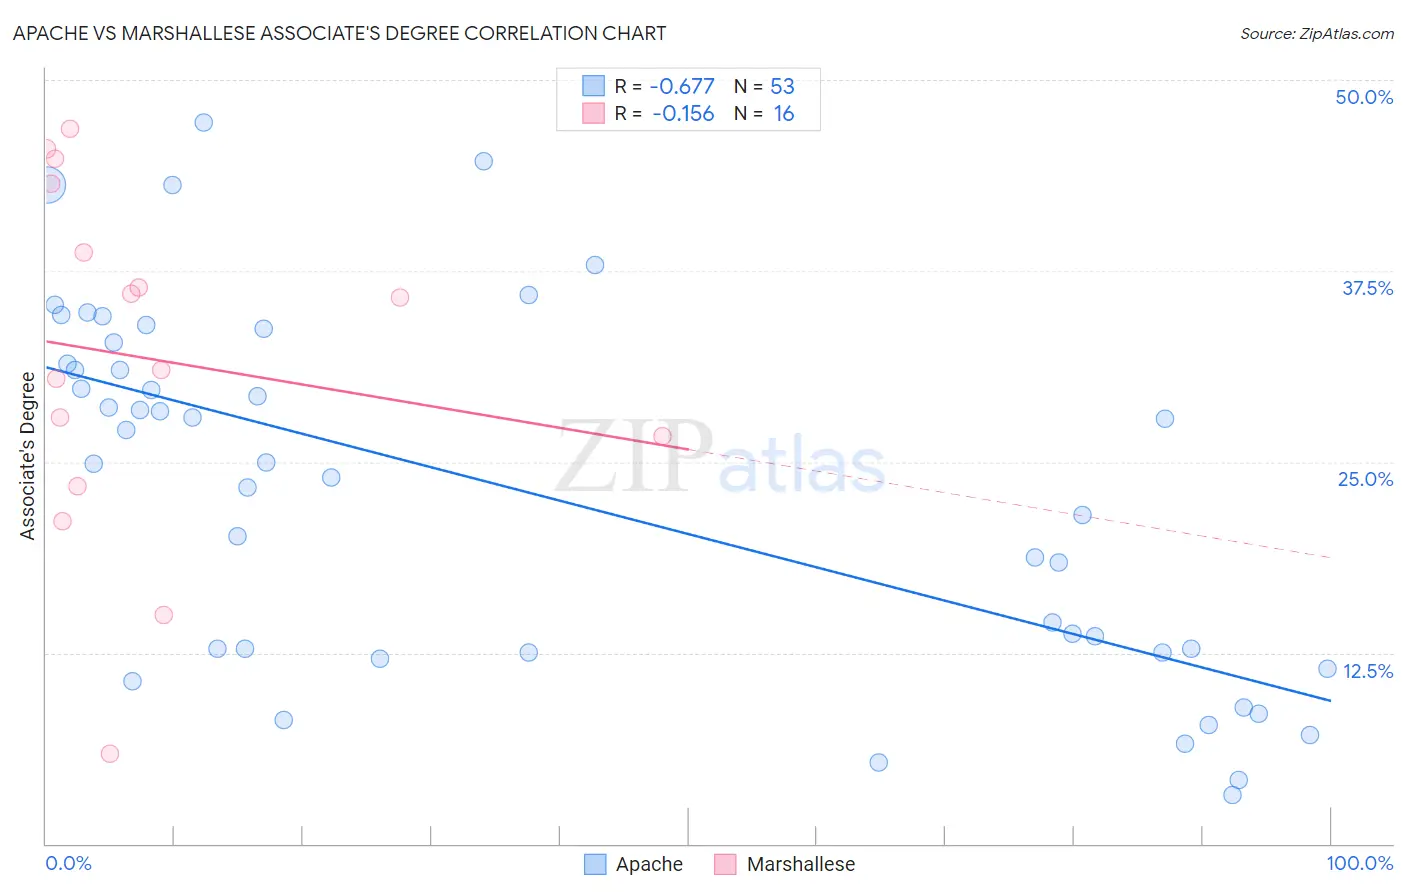
Apache vs Marshallese Associate's Degree Correlation Chart
The statistical analysis conducted on geographies consisting of 231,140,415 people shows a significant negative correlation between the proportion of Apache and percentage of population with at least associate's degree education in the United States with a correlation coefficient (R) of -0.677 and weighted average of 36.2%. Similarly, the statistical analysis conducted on geographies consisting of 14,761,315 people shows a poor negative correlation between the proportion of Marshallese and percentage of population with at least associate's degree education in the United States with a correlation coefficient (R) of -0.156 and weighted average of 41.6%, a difference of 14.6%.
Associate's Degree Correlation Summary
| Measurement | Apache | Marshallese |
| Minimum | 3.2% | 5.9% |
| Maximum | 47.2% | 46.8% |
| Range | 44.0% | 40.9% |
| Mean | 23.0% | 31.8% |
| Median | 24.9% | 33.4% |
| Interquartile 25% (IQ1) | 12.5% | 25.1% |
| Interquartile 75% (IQ3) | 32.1% | 41.0% |
| Interquartile Range (IQR) | 19.6% | 15.9% |
| Standard Deviation (Sample) | 11.9% | 11.5% |
| Standard Deviation (Population) | 11.7% | 11.2% |
Similar Demographics by Associate's Degree
Demographics Similar to Apache by Associate's Degree
In terms of associate's degree, the demographic groups most similar to Apache are Paiute (36.4%, a difference of 0.31%), Alaskan Athabascan (36.5%, a difference of 0.60%), Dutch West Indian (36.5%, a difference of 0.61%), Kiowa (36.5%, a difference of 0.63%), and Menominee (36.7%, a difference of 1.2%).
| Demographics | Rating | Rank | Associate's Degree |
| Immigrants | Cabo Verde | 0.0 /100 | #323 | Tragic 36.8% |
| Arapaho | 0.0 /100 | #324 | Tragic 36.7% |
| Menominee | 0.0 /100 | #325 | Tragic 36.7% |
| Kiowa | 0.0 /100 | #326 | Tragic 36.5% |
| Dutch West Indians | 0.0 /100 | #327 | Tragic 36.5% |
| Alaskan Athabascans | 0.0 /100 | #328 | Tragic 36.5% |
| Paiute | 0.0 /100 | #329 | Tragic 36.4% |
| Apache | 0.0 /100 | #330 | Tragic 36.2% |
| Immigrants | Azores | 0.0 /100 | #331 | Tragic 35.6% |
| Immigrants | Central America | 0.0 /100 | #332 | Tragic 35.0% |
| Mexicans | 0.0 /100 | #333 | Tragic 35.0% |
| Natives/Alaskans | 0.0 /100 | #334 | Tragic 34.9% |
| Spanish American Indians | 0.0 /100 | #335 | Tragic 34.9% |
| Hopi | 0.0 /100 | #336 | Tragic 34.6% |
| Lumbee | 0.0 /100 | #337 | Tragic 34.1% |
Demographics Similar to Marshallese by Associate's Degree
In terms of associate's degree, the demographic groups most similar to Marshallese are Nicaraguan (41.5%, a difference of 0.13%), Malaysian (41.6%, a difference of 0.19%), Bahamian (41.5%, a difference of 0.22%), Immigrants from Jamaica (41.5%, a difference of 0.24%), and Osage (41.5%, a difference of 0.25%).
| Demographics | Rating | Rank | Associate's Degree |
| Indonesians | 0.6 /100 | #253 | Tragic 41.9% |
| Cubans | 0.6 /100 | #254 | Tragic 41.9% |
| Immigrants | Guyana | 0.5 /100 | #255 | Tragic 41.8% |
| Immigrants | Congo | 0.5 /100 | #256 | Tragic 41.8% |
| Spanish Americans | 0.5 /100 | #257 | Tragic 41.8% |
| Japanese | 0.5 /100 | #258 | Tragic 41.7% |
| Malaysians | 0.4 /100 | #259 | Tragic 41.6% |
| Marshallese | 0.4 /100 | #260 | Tragic 41.6% |
| Nicaraguans | 0.4 /100 | #261 | Tragic 41.5% |
| Bahamians | 0.4 /100 | #262 | Tragic 41.5% |
| Immigrants | Jamaica | 0.3 /100 | #263 | Tragic 41.5% |
| Osage | 0.3 /100 | #264 | Tragic 41.5% |
| Africans | 0.2 /100 | #265 | Tragic 41.1% |
| Samoans | 0.2 /100 | #266 | Tragic 41.1% |
| Hawaiians | 0.2 /100 | #267 | Tragic 40.9% |