Apache vs Dominican Child Poverty Under the Age of 5
COMPARE
Apache
Dominican
Child Poverty Under the Age of 5
Child Poverty Under the Age of 5 Comparison
Apache
Dominicans
25.0%
CHILD POVERTY UNDER THE AGE OF 5
0.0/ 100
METRIC RATING
332nd/ 347
METRIC RANK
24.0%
CHILD POVERTY UNDER THE AGE OF 5
0.0/ 100
METRIC RATING
327th/ 347
METRIC RANK
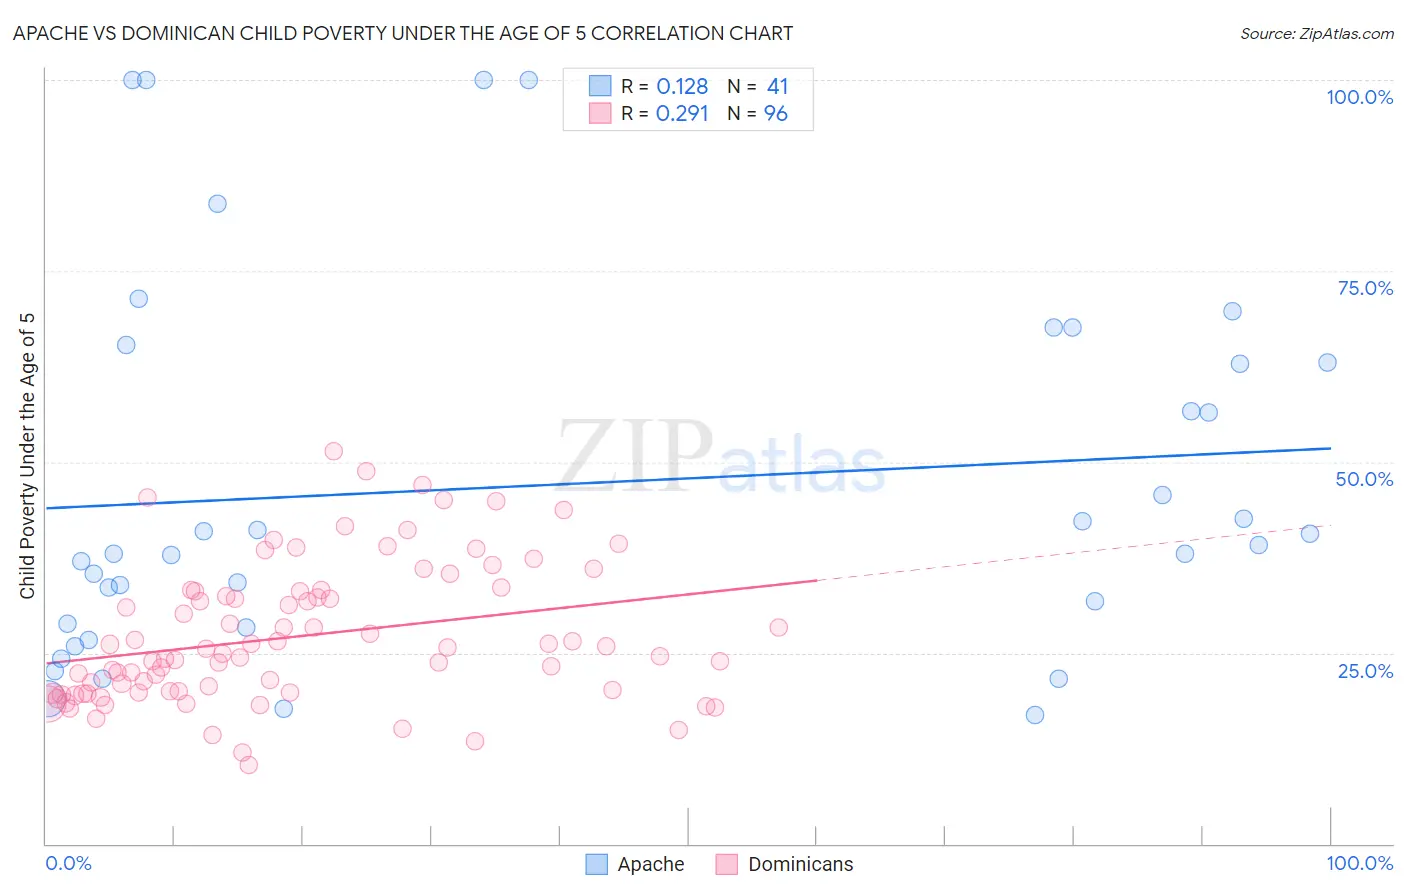
Apache vs Dominican Child Poverty Under the Age of 5 Correlation Chart
The statistical analysis conducted on geographies consisting of 227,703,796 people shows a poor positive correlation between the proportion of Apache and poverty level among children under the age of 5 in the United States with a correlation coefficient (R) of 0.128 and weighted average of 25.0%. Similarly, the statistical analysis conducted on geographies consisting of 342,515,454 people shows a weak positive correlation between the proportion of Dominicans and poverty level among children under the age of 5 in the United States with a correlation coefficient (R) of 0.291 and weighted average of 24.0%, a difference of 4.0%.
Child Poverty Under the Age of 5 Correlation Summary
| Measurement | Apache | Dominican |
| Minimum | 16.9% | 10.3% |
| Maximum | 100.0% | 51.4% |
| Range | 83.1% | 41.1% |
| Mean | 47.1% | 27.2% |
| Median | 39.2% | 25.2% |
| Interquartile 25% (IQ1) | 28.6% | 19.9% |
| Interquartile 75% (IQ3) | 64.1% | 33.1% |
| Interquartile Range (IQR) | 35.5% | 13.2% |
| Standard Deviation (Sample) | 24.2% | 9.0% |
| Standard Deviation (Population) | 23.9% | 9.0% |
Demographics Similar to Apache and Dominicans by Child Poverty Under the Age of 5
In terms of child poverty under the age of 5, the demographic groups most similar to Apache are Kiowa (24.5%, a difference of 2.2%), Native/Alaskan (25.6%, a difference of 2.2%), Black/African American (25.7%, a difference of 2.8%), Colville (25.7%, a difference of 2.8%), and Creek (24.2%, a difference of 3.2%). Similarly, the demographic groups most similar to Dominicans are Immigrants from Dominican Republic (24.1%, a difference of 0.090%), Cajun (24.1%, a difference of 0.32%), Central American Indian (23.9%, a difference of 0.45%), Immigrants from Congo (23.9%, a difference of 0.64%), and Creek (24.2%, a difference of 0.76%).
| Demographics | Rating | Rank | Child Poverty Under the Age of 5 |
| Chippewa | 0.0 /100 | #319 | Tragic 23.4% |
| Choctaw | 0.0 /100 | #320 | Tragic 23.5% |
| Immigrants | Honduras | 0.0 /100 | #321 | Tragic 23.5% |
| Ute | 0.0 /100 | #322 | Tragic 23.5% |
| Pueblo | 0.0 /100 | #323 | Tragic 23.7% |
| Paiute | 0.0 /100 | #324 | Tragic 23.8% |
| Immigrants | Congo | 0.0 /100 | #325 | Tragic 23.9% |
| Central American Indians | 0.0 /100 | #326 | Tragic 23.9% |
| Dominicans | 0.0 /100 | #327 | Tragic 24.0% |
| Immigrants | Dominican Republic | 0.0 /100 | #328 | Tragic 24.1% |
| Cajuns | 0.0 /100 | #329 | Tragic 24.1% |
| Creek | 0.0 /100 | #330 | Tragic 24.2% |
| Kiowa | 0.0 /100 | #331 | Tragic 24.5% |
| Apache | 0.0 /100 | #332 | Tragic 25.0% |
| Natives/Alaskans | 0.0 /100 | #333 | Tragic 25.6% |
| Blacks/African Americans | 0.0 /100 | #334 | Tragic 25.7% |
| Colville | 0.0 /100 | #335 | Tragic 25.7% |
| Sioux | 0.0 /100 | #336 | Tragic 26.9% |
| Pima | 0.0 /100 | #337 | Tragic 27.4% |
| Hopi | 0.0 /100 | #338 | Tragic 27.7% |
| Yup'ik | 0.0 /100 | #339 | Tragic 27.7% |