Apache vs Marshallese Median Family Income
COMPARE
Apache
Marshallese
Median Family Income
Median Family Income Comparison
Apache
Marshallese
$84,451
MEDIAN FAMILY INCOME
0.0/ 100
METRIC RATING
315th/ 347
METRIC RANK
$95,293
MEDIAN FAMILY INCOME
2.2/ 100
METRIC RATING
229th/ 347
METRIC RANK
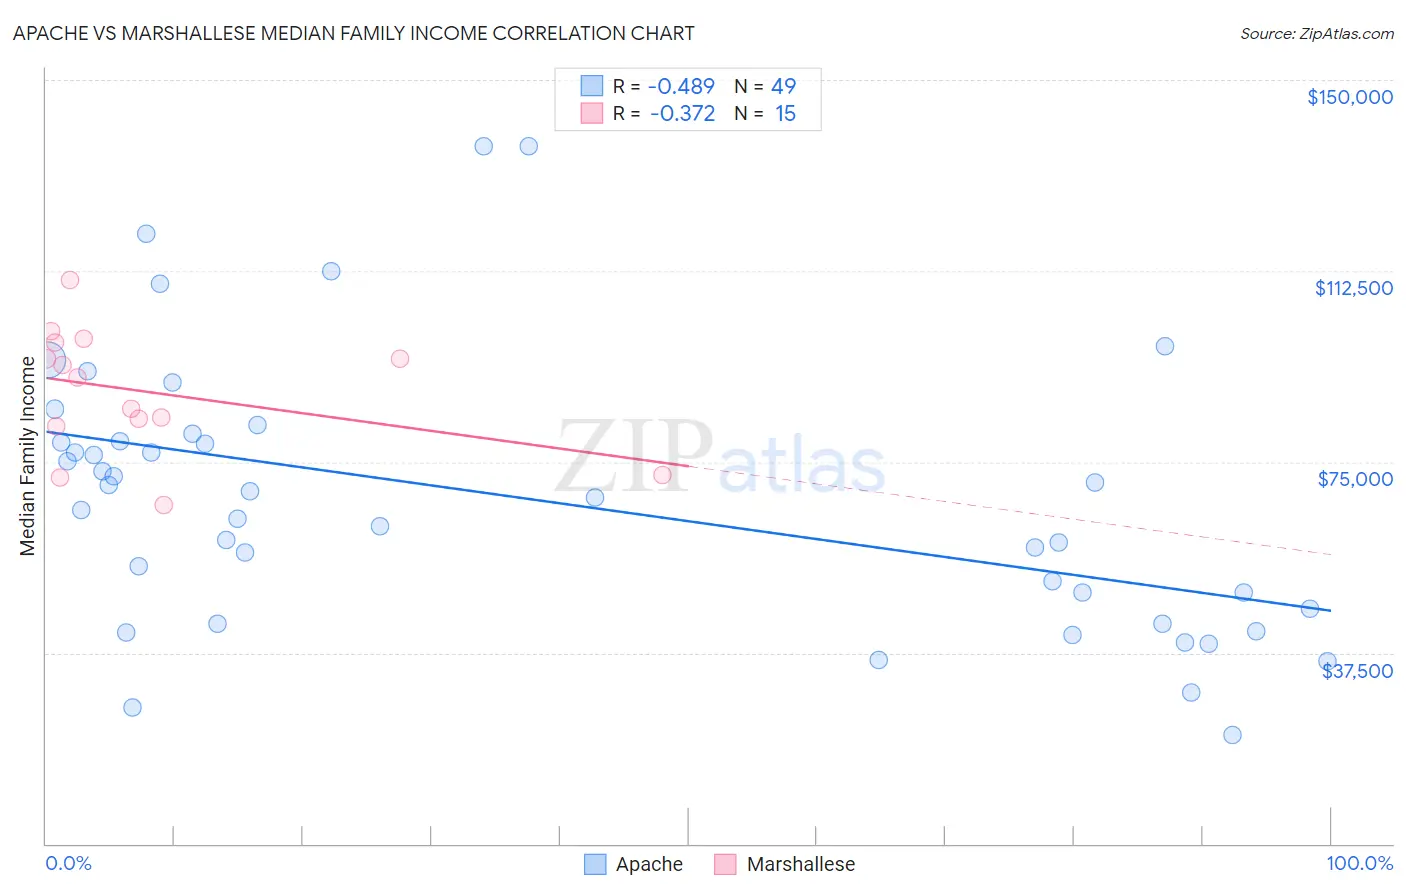
Apache vs Marshallese Median Family Income Correlation Chart
The statistical analysis conducted on geographies consisting of 231,007,077 people shows a moderate negative correlation between the proportion of Apache and median family income in the United States with a correlation coefficient (R) of -0.489 and weighted average of $84,451. Similarly, the statistical analysis conducted on geographies consisting of 14,760,991 people shows a mild negative correlation between the proportion of Marshallese and median family income in the United States with a correlation coefficient (R) of -0.372 and weighted average of $95,293, a difference of 12.8%.
Median Family Income Correlation Summary
| Measurement | Apache | Marshallese |
| Minimum | $21,444 | $66,563 |
| Maximum | $136,944 | $110,724 |
| Range | $115,500 | $44,161 |
| Mean | $67,810 | $88,730 |
| Median | $68,015 | $91,530 |
| Interquartile 25% (IQ1) | $44,680 | $81,946 |
| Interquartile 75% (IQ3) | $79,729 | $98,411 |
| Interquartile Range (IQR) | $35,049 | $16,465 |
| Standard Deviation (Sample) | $26,784 | $12,233 |
| Standard Deviation (Population) | $26,510 | $11,818 |
Similar Demographics by Median Family Income
Demographics Similar to Apache by Median Family Income
In terms of median family income, the demographic groups most similar to Apache are Immigrants from Bahamas ($84,732, a difference of 0.33%), Choctaw ($84,835, a difference of 0.45%), Immigrants from Haiti ($84,018, a difference of 0.52%), Yakama ($83,932, a difference of 0.62%), and Cuban ($84,981, a difference of 0.63%).
| Demographics | Rating | Rank | Median Family Income |
| U.S. Virgin Islanders | 0.0 /100 | #308 | Tragic $85,294 |
| Haitians | 0.0 /100 | #309 | Tragic $85,218 |
| Immigrants | Central America | 0.0 /100 | #310 | Tragic $85,050 |
| Hondurans | 0.0 /100 | #311 | Tragic $85,004 |
| Cubans | 0.0 /100 | #312 | Tragic $84,981 |
| Choctaw | 0.0 /100 | #313 | Tragic $84,835 |
| Immigrants | Bahamas | 0.0 /100 | #314 | Tragic $84,732 |
| Apache | 0.0 /100 | #315 | Tragic $84,451 |
| Immigrants | Haiti | 0.0 /100 | #316 | Tragic $84,018 |
| Yakama | 0.0 /100 | #317 | Tragic $83,932 |
| Immigrants | Mexico | 0.0 /100 | #318 | Tragic $83,639 |
| Immigrants | Honduras | 0.0 /100 | #319 | Tragic $83,618 |
| Seminole | 0.0 /100 | #320 | Tragic $83,354 |
| Immigrants | Caribbean | 0.0 /100 | #321 | Tragic $83,319 |
| Dominicans | 0.0 /100 | #322 | Tragic $82,888 |
Demographics Similar to Marshallese by Median Family Income
In terms of median family income, the demographic groups most similar to Marshallese are Malaysian ($95,230, a difference of 0.070%), Immigrants from the Azores ($95,402, a difference of 0.11%), Ecuadorian ($95,114, a difference of 0.19%), Alaska Native ($95,573, a difference of 0.29%), and Immigrants from Panama ($95,647, a difference of 0.37%).
| Demographics | Rating | Rank | Median Family Income |
| Immigrants | Nigeria | 4.0 /100 | #222 | Tragic $96,439 |
| Venezuelans | 3.7 /100 | #223 | Tragic $96,281 |
| Immigrants | Nonimmigrants | 3.6 /100 | #224 | Tragic $96,231 |
| Vietnamese | 3.4 /100 | #225 | Tragic $96,123 |
| Immigrants | Panama | 2.7 /100 | #226 | Tragic $95,647 |
| Alaska Natives | 2.6 /100 | #227 | Tragic $95,573 |
| Immigrants | Azores | 2.4 /100 | #228 | Tragic $95,402 |
| Marshallese | 2.2 /100 | #229 | Tragic $95,293 |
| Malaysians | 2.2 /100 | #230 | Tragic $95,230 |
| Ecuadorians | 2.1 /100 | #231 | Tragic $95,114 |
| Immigrants | Venezuela | 1.9 /100 | #232 | Tragic $94,904 |
| Immigrants | Bangladesh | 1.6 /100 | #233 | Tragic $94,665 |
| Immigrants | Western Africa | 1.6 /100 | #234 | Tragic $94,638 |
| Immigrants | Burma/Myanmar | 1.5 /100 | #235 | Tragic $94,472 |
| Trinidadians and Tobagonians | 1.5 /100 | #236 | Tragic $94,466 |