Apache vs Indonesian Child Poverty Under the Age of 5
COMPARE
Apache
Indonesian
Child Poverty Under the Age of 5
Child Poverty Under the Age of 5 Comparison
Apache
Indonesians
25.0%
CHILD POVERTY UNDER THE AGE OF 5
0.0/ 100
METRIC RATING
332nd/ 347
METRIC RANK
22.3%
CHILD POVERTY UNDER THE AGE OF 5
0.0/ 100
METRIC RATING
306th/ 347
METRIC RANK
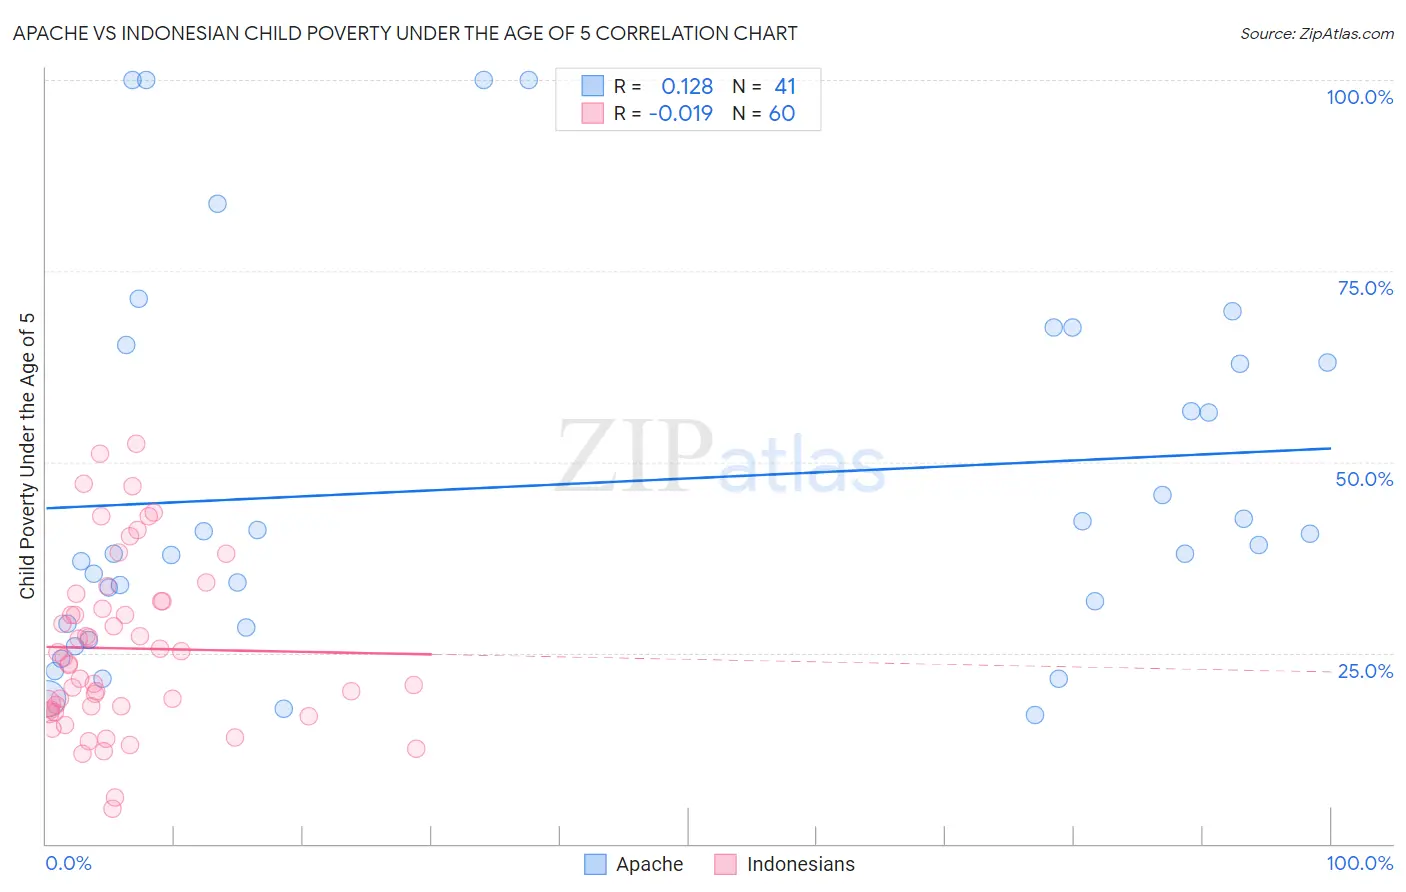
Apache vs Indonesian Child Poverty Under the Age of 5 Correlation Chart
The statistical analysis conducted on geographies consisting of 227,703,796 people shows a poor positive correlation between the proportion of Apache and poverty level among children under the age of 5 in the United States with a correlation coefficient (R) of 0.128 and weighted average of 25.0%. Similarly, the statistical analysis conducted on geographies consisting of 159,867,886 people shows no correlation between the proportion of Indonesians and poverty level among children under the age of 5 in the United States with a correlation coefficient (R) of -0.019 and weighted average of 22.3%, a difference of 12.3%.
Child Poverty Under the Age of 5 Correlation Summary
| Measurement | Apache | Indonesian |
| Minimum | 16.9% | 4.6% |
| Maximum | 100.0% | 52.3% |
| Range | 83.1% | 47.8% |
| Mean | 47.1% | 25.6% |
| Median | 39.2% | 24.0% |
| Interquartile 25% (IQ1) | 28.6% | 17.8% |
| Interquartile 75% (IQ3) | 64.1% | 31.8% |
| Interquartile Range (IQR) | 35.5% | 14.0% |
| Standard Deviation (Sample) | 24.2% | 11.1% |
| Standard Deviation (Population) | 23.9% | 11.0% |
Similar Demographics by Child Poverty Under the Age of 5
Demographics Similar to Apache by Child Poverty Under the Age of 5
In terms of child poverty under the age of 5, the demographic groups most similar to Apache are Kiowa (24.5%, a difference of 2.2%), Native/Alaskan (25.6%, a difference of 2.2%), Black/African American (25.7%, a difference of 2.8%), Colville (25.7%, a difference of 2.8%), and Creek (24.2%, a difference of 3.2%).
| Demographics | Rating | Rank | Child Poverty Under the Age of 5 |
| Immigrants | Congo | 0.0 /100 | #325 | Tragic 23.9% |
| Central American Indians | 0.0 /100 | #326 | Tragic 23.9% |
| Dominicans | 0.0 /100 | #327 | Tragic 24.0% |
| Immigrants | Dominican Republic | 0.0 /100 | #328 | Tragic 24.1% |
| Cajuns | 0.0 /100 | #329 | Tragic 24.1% |
| Creek | 0.0 /100 | #330 | Tragic 24.2% |
| Kiowa | 0.0 /100 | #331 | Tragic 24.5% |
| Apache | 0.0 /100 | #332 | Tragic 25.0% |
| Natives/Alaskans | 0.0 /100 | #333 | Tragic 25.6% |
| Blacks/African Americans | 0.0 /100 | #334 | Tragic 25.7% |
| Colville | 0.0 /100 | #335 | Tragic 25.7% |
| Sioux | 0.0 /100 | #336 | Tragic 26.9% |
| Pima | 0.0 /100 | #337 | Tragic 27.4% |
| Hopi | 0.0 /100 | #338 | Tragic 27.7% |
| Yup'ik | 0.0 /100 | #339 | Tragic 27.7% |
Demographics Similar to Indonesians by Child Poverty Under the Age of 5
In terms of child poverty under the age of 5, the demographic groups most similar to Indonesians are Immigrants from Mexico (22.2%, a difference of 0.060%), Immigrants from Guatemala (22.0%, a difference of 0.92%), Inupiat (22.0%, a difference of 1.0%), Iroquois (22.0%, a difference of 1.1%), and Immigrants from Central America (22.0%, a difference of 1.3%).
| Demographics | Rating | Rank | Child Poverty Under the Age of 5 |
| Chickasaw | 0.0 /100 | #299 | Tragic 21.8% |
| Alaskan Athabascans | 0.0 /100 | #300 | Tragic 21.8% |
| Immigrants | Central America | 0.0 /100 | #301 | Tragic 22.0% |
| Iroquois | 0.0 /100 | #302 | Tragic 22.0% |
| Inupiat | 0.0 /100 | #303 | Tragic 22.0% |
| Immigrants | Guatemala | 0.0 /100 | #304 | Tragic 22.0% |
| Immigrants | Mexico | 0.0 /100 | #305 | Tragic 22.2% |
| Indonesians | 0.0 /100 | #306 | Tragic 22.3% |
| Immigrants | Bahamas | 0.0 /100 | #307 | Tragic 22.7% |
| Immigrants | Dominica | 0.0 /100 | #308 | Tragic 22.7% |
| Houma | 0.0 /100 | #309 | Tragic 22.7% |
| Africans | 0.0 /100 | #310 | Tragic 22.8% |
| Seminole | 0.0 /100 | #311 | Tragic 22.8% |
| Hondurans | 0.0 /100 | #312 | Tragic 23.0% |
| Bahamians | 0.0 /100 | #313 | Tragic 23.0% |