Menominee vs Marshallese Child Poverty Under the Age of 5
COMPARE
Menominee
Marshallese
Child Poverty Under the Age of 5
Child Poverty Under the Age of 5 Comparison
Menominee
Marshallese
23.3%
CHILD POVERTY UNDER THE AGE OF 5
0.0/ 100
METRIC RATING
317th/ 347
METRIC RANK
19.7%
CHILD POVERTY UNDER THE AGE OF 5
0.4/ 100
METRIC RATING
248th/ 347
METRIC RANK
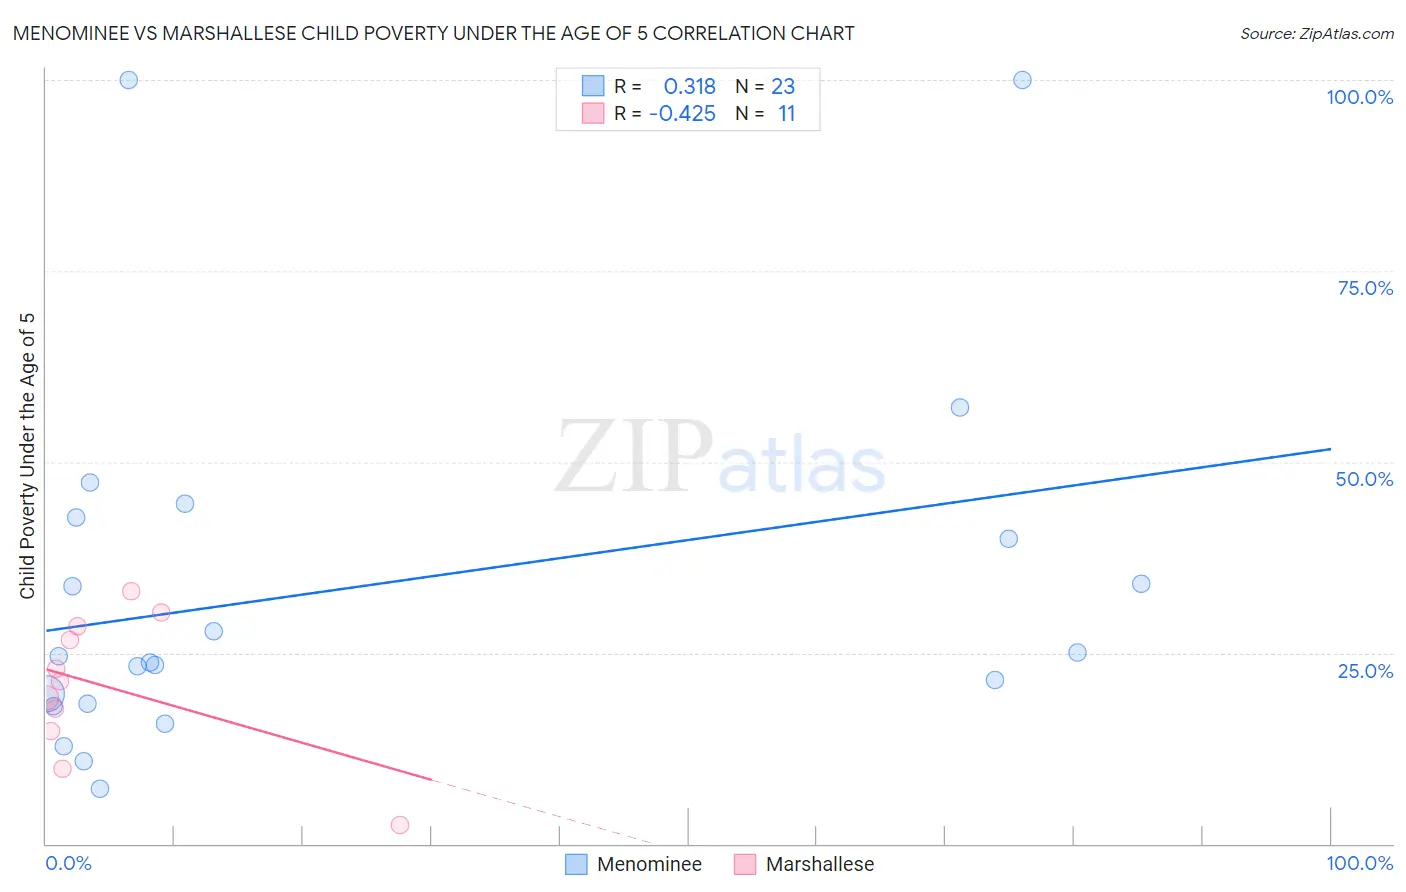
Menominee vs Marshallese Child Poverty Under the Age of 5 Correlation Chart
The statistical analysis conducted on geographies consisting of 45,389,615 people shows a mild positive correlation between the proportion of Menominee and poverty level among children under the age of 5 in the United States with a correlation coefficient (R) of 0.318 and weighted average of 23.3%. Similarly, the statistical analysis conducted on geographies consisting of 14,701,855 people shows a moderate negative correlation between the proportion of Marshallese and poverty level among children under the age of 5 in the United States with a correlation coefficient (R) of -0.425 and weighted average of 19.7%, a difference of 17.9%.
Child Poverty Under the Age of 5 Correlation Summary
| Measurement | Menominee | Marshallese |
| Minimum | 7.1% | 2.4% |
| Maximum | 100.0% | 33.0% |
| Range | 92.9% | 30.6% |
| Mean | 33.5% | 20.6% |
| Median | 24.6% | 21.2% |
| Interquartile 25% (IQ1) | 18.4% | 14.8% |
| Interquartile 75% (IQ3) | 42.7% | 28.6% |
| Interquartile Range (IQR) | 24.3% | 13.8% |
| Standard Deviation (Sample) | 24.4% | 9.2% |
| Standard Deviation (Population) | 23.9% | 8.8% |
Similar Demographics by Child Poverty Under the Age of 5
Demographics Similar to Menominee by Child Poverty Under the Age of 5
In terms of child poverty under the age of 5, the demographic groups most similar to Menominee are Dutch West Indian (23.3%, a difference of 0.10%), Yakama (23.1%, a difference of 0.50%), Chippewa (23.4%, a difference of 0.58%), Arapaho (23.1%, a difference of 0.62%), and Choctaw (23.5%, a difference of 0.96%).
| Demographics | Rating | Rank | Child Poverty Under the Age of 5 |
| Africans | 0.0 /100 | #310 | Tragic 22.8% |
| Seminole | 0.0 /100 | #311 | Tragic 22.8% |
| Hondurans | 0.0 /100 | #312 | Tragic 23.0% |
| Bahamians | 0.0 /100 | #313 | Tragic 23.0% |
| U.S. Virgin Islanders | 0.0 /100 | #314 | Tragic 23.0% |
| Arapaho | 0.0 /100 | #315 | Tragic 23.1% |
| Yakama | 0.0 /100 | #316 | Tragic 23.1% |
| Menominee | 0.0 /100 | #317 | Tragic 23.3% |
| Dutch West Indians | 0.0 /100 | #318 | Tragic 23.3% |
| Chippewa | 0.0 /100 | #319 | Tragic 23.4% |
| Choctaw | 0.0 /100 | #320 | Tragic 23.5% |
| Immigrants | Honduras | 0.0 /100 | #321 | Tragic 23.5% |
| Ute | 0.0 /100 | #322 | Tragic 23.5% |
| Pueblo | 0.0 /100 | #323 | Tragic 23.7% |
| Paiute | 0.0 /100 | #324 | Tragic 23.8% |
Demographics Similar to Marshallese by Child Poverty Under the Age of 5
In terms of child poverty under the age of 5, the demographic groups most similar to Marshallese are Guyanese (19.7%, a difference of 0.010%), Immigrants from Middle Africa (19.7%, a difference of 0.020%), Nonimmigrants (19.7%, a difference of 0.070%), Cree (19.7%, a difference of 0.17%), and Pennsylvania German (19.8%, a difference of 0.24%).
| Demographics | Rating | Rank | Child Poverty Under the Age of 5 |
| Alaska Natives | 0.5 /100 | #241 | Tragic 19.6% |
| Immigrants | Guyana | 0.5 /100 | #242 | Tragic 19.6% |
| Osage | 0.5 /100 | #243 | Tragic 19.6% |
| Immigrants | Ghana | 0.5 /100 | #244 | Tragic 19.6% |
| Immigrants | Western Africa | 0.4 /100 | #245 | Tragic 19.7% |
| Cree | 0.4 /100 | #246 | Tragic 19.7% |
| Guyanese | 0.4 /100 | #247 | Tragic 19.7% |
| Marshallese | 0.4 /100 | #248 | Tragic 19.7% |
| Immigrants | Middle Africa | 0.4 /100 | #249 | Tragic 19.7% |
| Immigrants | Nonimmigrants | 0.4 /100 | #250 | Tragic 19.7% |
| Pennsylvania Germans | 0.3 /100 | #251 | Tragic 19.8% |
| Immigrants | Nicaragua | 0.3 /100 | #252 | Tragic 19.8% |
| Mexican American Indians | 0.3 /100 | #253 | Tragic 19.9% |
| Fijians | 0.3 /100 | #254 | Tragic 19.9% |
| Immigrants | Cuba | 0.2 /100 | #255 | Tragic 19.9% |