Apache vs Immigrants from Haiti Child Poverty Under the Age of 5
COMPARE
Apache
Immigrants from Haiti
Child Poverty Under the Age of 5
Child Poverty Under the Age of 5 Comparison
Apache
Immigrants from Haiti
25.0%
CHILD POVERTY UNDER THE AGE OF 5
0.0/ 100
METRIC RATING
332nd/ 347
METRIC RANK
21.3%
CHILD POVERTY UNDER THE AGE OF 5
0.0/ 100
METRIC RATING
289th/ 347
METRIC RANK
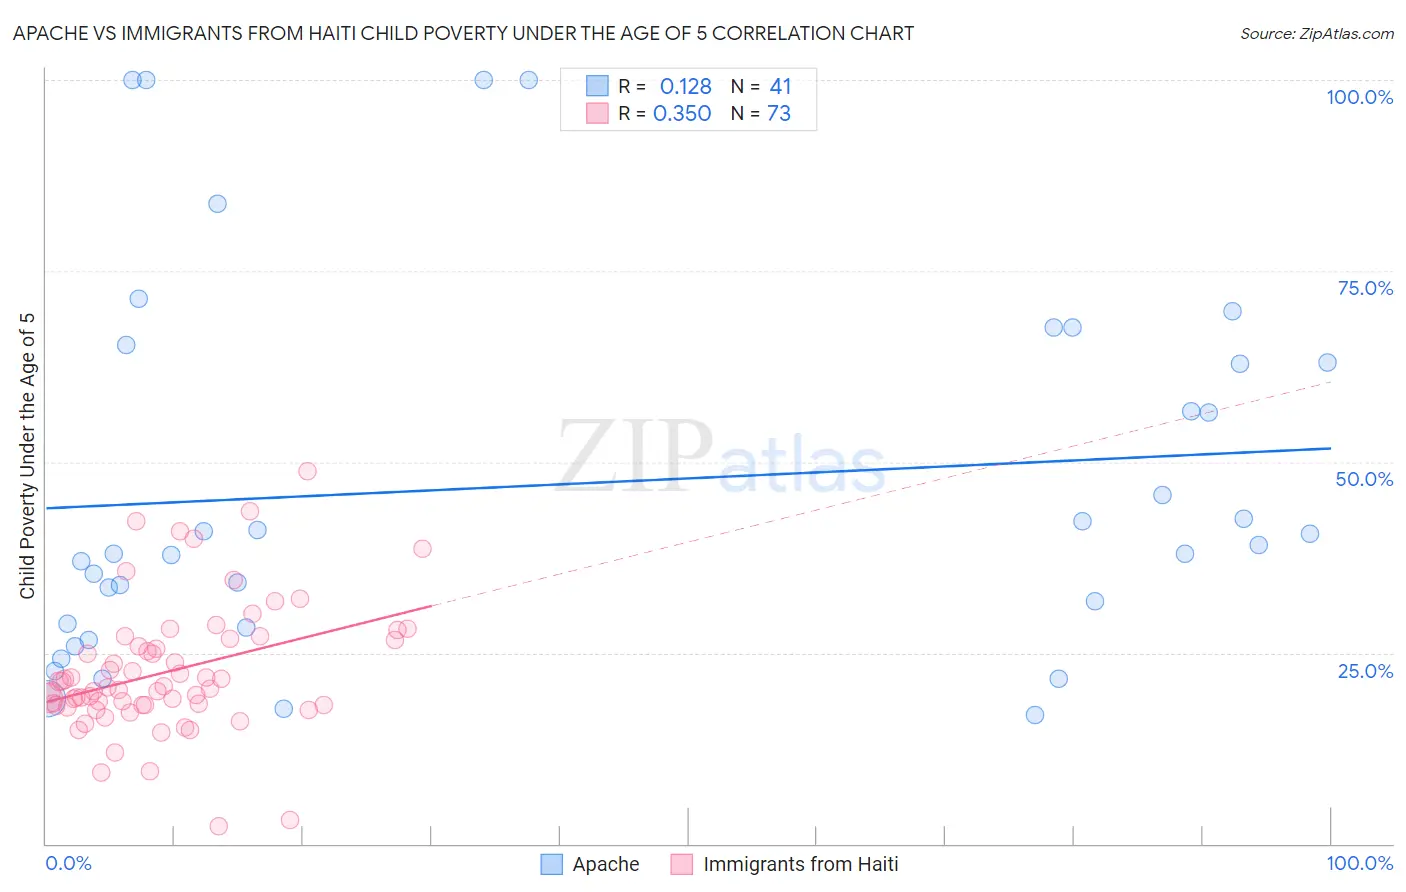
Apache vs Immigrants from Haiti Child Poverty Under the Age of 5 Correlation Chart
The statistical analysis conducted on geographies consisting of 227,703,796 people shows a poor positive correlation between the proportion of Apache and poverty level among children under the age of 5 in the United States with a correlation coefficient (R) of 0.128 and weighted average of 25.0%. Similarly, the statistical analysis conducted on geographies consisting of 219,538,248 people shows a mild positive correlation between the proportion of Immigrants from Haiti and poverty level among children under the age of 5 in the United States with a correlation coefficient (R) of 0.350 and weighted average of 21.3%, a difference of 17.3%.
Child Poverty Under the Age of 5 Correlation Summary
| Measurement | Apache | Immigrants from Haiti |
| Minimum | 16.9% | 2.3% |
| Maximum | 100.0% | 48.7% |
| Range | 83.1% | 46.4% |
| Mean | 47.1% | 22.5% |
| Median | 39.2% | 20.5% |
| Interquartile 25% (IQ1) | 28.6% | 18.1% |
| Interquartile 75% (IQ3) | 64.1% | 26.8% |
| Interquartile Range (IQR) | 35.5% | 8.7% |
| Standard Deviation (Sample) | 24.2% | 8.5% |
| Standard Deviation (Population) | 23.9% | 8.4% |
Similar Demographics by Child Poverty Under the Age of 5
Demographics Similar to Apache by Child Poverty Under the Age of 5
In terms of child poverty under the age of 5, the demographic groups most similar to Apache are Kiowa (24.5%, a difference of 2.2%), Native/Alaskan (25.6%, a difference of 2.2%), Black/African American (25.7%, a difference of 2.8%), Colville (25.7%, a difference of 2.8%), and Creek (24.2%, a difference of 3.2%).
| Demographics | Rating | Rank | Child Poverty Under the Age of 5 |
| Immigrants | Congo | 0.0 /100 | #325 | Tragic 23.9% |
| Central American Indians | 0.0 /100 | #326 | Tragic 23.9% |
| Dominicans | 0.0 /100 | #327 | Tragic 24.0% |
| Immigrants | Dominican Republic | 0.0 /100 | #328 | Tragic 24.1% |
| Cajuns | 0.0 /100 | #329 | Tragic 24.1% |
| Creek | 0.0 /100 | #330 | Tragic 24.2% |
| Kiowa | 0.0 /100 | #331 | Tragic 24.5% |
| Apache | 0.0 /100 | #332 | Tragic 25.0% |
| Natives/Alaskans | 0.0 /100 | #333 | Tragic 25.6% |
| Blacks/African Americans | 0.0 /100 | #334 | Tragic 25.7% |
| Colville | 0.0 /100 | #335 | Tragic 25.7% |
| Sioux | 0.0 /100 | #336 | Tragic 26.9% |
| Pima | 0.0 /100 | #337 | Tragic 27.4% |
| Hopi | 0.0 /100 | #338 | Tragic 27.7% |
| Yup'ik | 0.0 /100 | #339 | Tragic 27.7% |
Demographics Similar to Immigrants from Haiti by Child Poverty Under the Age of 5
In terms of child poverty under the age of 5, the demographic groups most similar to Immigrants from Haiti are Immigrants from Senegal (21.3%, a difference of 0.070%), Immigrants from Zaire (21.3%, a difference of 0.25%), Immigrants from Latin America (21.2%, a difference of 0.34%), Haitian (21.2%, a difference of 0.41%), and Immigrants from Caribbean (21.4%, a difference of 0.41%).
| Demographics | Rating | Rank | Child Poverty Under the Age of 5 |
| Potawatomi | 0.0 /100 | #282 | Tragic 21.0% |
| Comanche | 0.0 /100 | #283 | Tragic 21.0% |
| Somalis | 0.0 /100 | #284 | Tragic 21.1% |
| Haitians | 0.0 /100 | #285 | Tragic 21.2% |
| Immigrants | Latin America | 0.0 /100 | #286 | Tragic 21.2% |
| Immigrants | Zaire | 0.0 /100 | #287 | Tragic 21.3% |
| Immigrants | Senegal | 0.0 /100 | #288 | Tragic 21.3% |
| Immigrants | Haiti | 0.0 /100 | #289 | Tragic 21.3% |
| Immigrants | Caribbean | 0.0 /100 | #290 | Tragic 21.4% |
| British West Indians | 0.0 /100 | #291 | Tragic 21.4% |
| Immigrants | Somalia | 0.0 /100 | #292 | Tragic 21.6% |
| Mexicans | 0.0 /100 | #293 | Tragic 21.6% |
| Guatemalans | 0.0 /100 | #294 | Tragic 21.6% |
| Cherokee | 0.0 /100 | #295 | Tragic 21.7% |
| Yaqui | 0.0 /100 | #296 | Tragic 21.7% |