Apache vs Immigrants from Malaysia Single Male Poverty
COMPARE
Apache
Immigrants from Malaysia
Single Male Poverty
Single Male Poverty Comparison
Apache
Immigrants from Malaysia
21.6%
SINGLE MALE POVERTY
0.0/ 100
METRIC RATING
337th/ 347
METRIC RANK
12.0%
SINGLE MALE POVERTY
99.2/ 100
METRIC RATING
77th/ 347
METRIC RANK
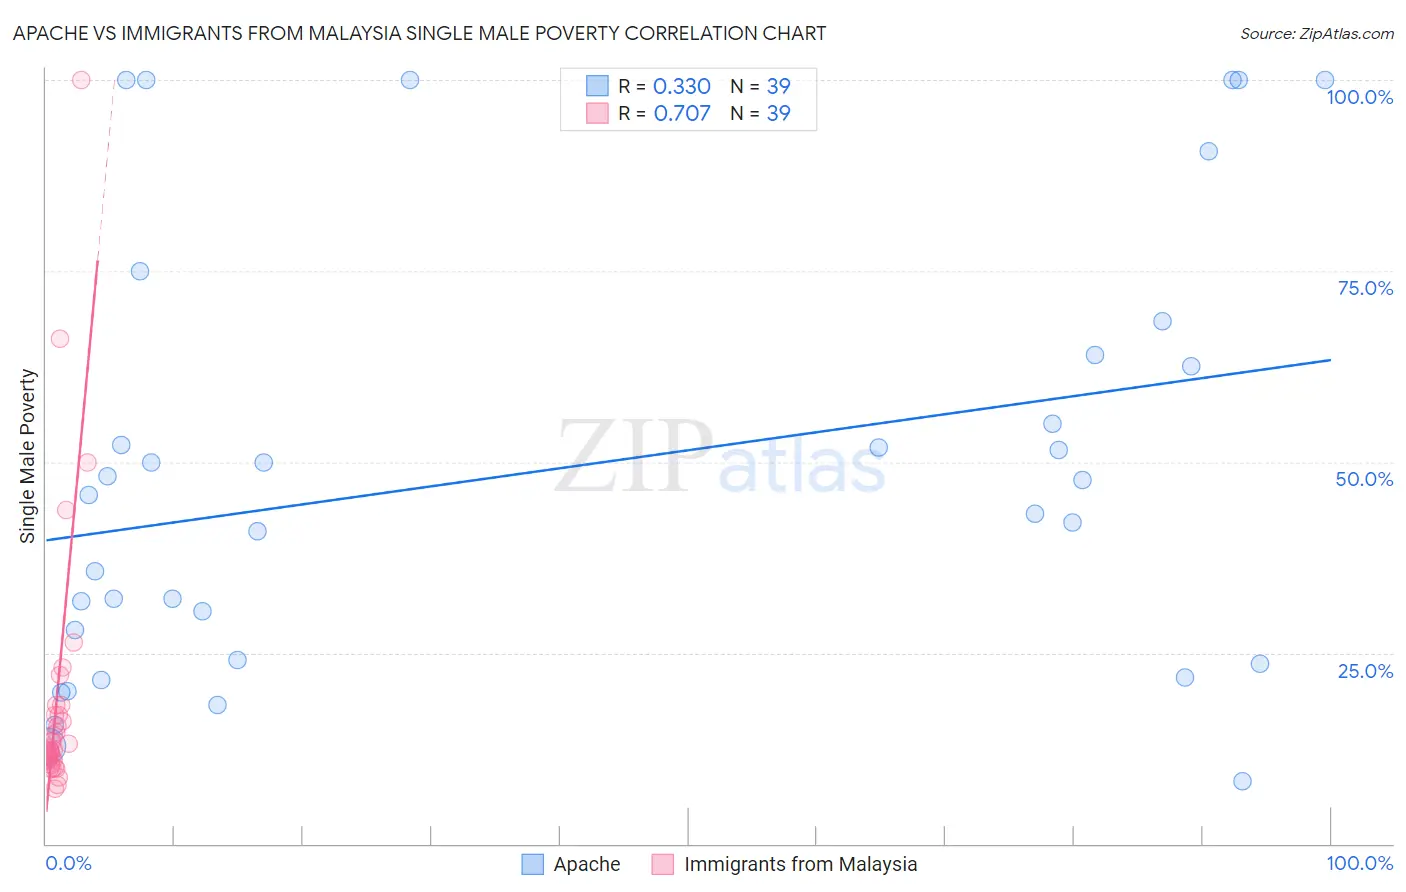
Apache vs Immigrants from Malaysia Single Male Poverty Correlation Chart
The statistical analysis conducted on geographies consisting of 216,687,885 people shows a mild positive correlation between the proportion of Apache and poverty level among single males in the United States with a correlation coefficient (R) of 0.330 and weighted average of 21.6%. Similarly, the statistical analysis conducted on geographies consisting of 183,302,457 people shows a strong positive correlation between the proportion of Immigrants from Malaysia and poverty level among single males in the United States with a correlation coefficient (R) of 0.707 and weighted average of 12.0%, a difference of 80.1%.
Single Male Poverty Correlation Summary
| Measurement | Apache | Immigrants from Malaysia |
| Minimum | 8.2% | 7.3% |
| Maximum | 100.0% | 100.0% |
| Range | 91.8% | 92.7% |
| Mean | 49.1% | 18.6% |
| Median | 45.6% | 12.3% |
| Interquartile 25% (IQ1) | 24.1% | 11.0% |
| Interquartile 75% (IQ3) | 64.0% | 16.8% |
| Interquartile Range (IQR) | 39.9% | 5.8% |
| Standard Deviation (Sample) | 28.3% | 17.8% |
| Standard Deviation (Population) | 27.9% | 17.6% |
Similar Demographics by Single Male Poverty
Demographics Similar to Apache by Single Male Poverty
In terms of single male poverty, the demographic groups most similar to Apache are Tohono O'odham (21.6%, a difference of 0.10%), Pueblo (21.6%, a difference of 0.18%), Yuman (21.3%, a difference of 1.3%), Arapaho (21.9%, a difference of 1.7%), and Sioux (22.2%, a difference of 2.9%).
| Demographics | Rating | Rank | Single Male Poverty |
| Cajuns | 0.0 /100 | #330 | Tragic 19.1% |
| Paiute | 0.0 /100 | #331 | Tragic 19.3% |
| Natives/Alaskans | 0.0 /100 | #332 | Tragic 19.6% |
| Inupiat | 0.0 /100 | #333 | Tragic 20.0% |
| Pima | 0.0 /100 | #334 | Tragic 20.2% |
| Yuman | 0.0 /100 | #335 | Tragic 21.3% |
| Tohono O'odham | 0.0 /100 | #336 | Tragic 21.6% |
| Apache | 0.0 /100 | #337 | Tragic 21.6% |
| Pueblo | 0.0 /100 | #338 | Tragic 21.6% |
| Arapaho | 0.0 /100 | #339 | Tragic 21.9% |
| Sioux | 0.0 /100 | #340 | Tragic 22.2% |
| Crow | 0.0 /100 | #341 | Tragic 23.3% |
| Houma | 0.0 /100 | #342 | Tragic 23.5% |
| Puerto Ricans | 0.0 /100 | #343 | Tragic 25.1% |
| Lumbee | 0.0 /100 | #344 | Tragic 25.2% |
Demographics Similar to Immigrants from Malaysia by Single Male Poverty
In terms of single male poverty, the demographic groups most similar to Immigrants from Malaysia are Immigrants from Venezuela (12.0%, a difference of 0.25%), Immigrants from Northern Africa (11.9%, a difference of 0.26%), Uruguayan (11.9%, a difference of 0.29%), Immigrants from Belgium (12.0%, a difference of 0.36%), and Chilean (11.9%, a difference of 0.48%).
| Demographics | Rating | Rank | Single Male Poverty |
| Immigrants | Nepal | 99.6 /100 | #70 | Exceptional 11.9% |
| Immigrants | Greece | 99.6 /100 | #71 | Exceptional 11.9% |
| Immigrants | Argentina | 99.5 /100 | #72 | Exceptional 11.9% |
| Argentineans | 99.5 /100 | #73 | Exceptional 11.9% |
| Chileans | 99.5 /100 | #74 | Exceptional 11.9% |
| Uruguayans | 99.4 /100 | #75 | Exceptional 11.9% |
| Immigrants | Northern Africa | 99.4 /100 | #76 | Exceptional 11.9% |
| Immigrants | Malaysia | 99.2 /100 | #77 | Exceptional 12.0% |
| Immigrants | Venezuela | 99.1 /100 | #78 | Exceptional 12.0% |
| Immigrants | Belgium | 99.0 /100 | #79 | Exceptional 12.0% |
| Armenians | 98.7 /100 | #80 | Exceptional 12.1% |
| Immigrants | South America | 98.7 /100 | #81 | Exceptional 12.1% |
| Immigrants | Colombia | 98.6 /100 | #82 | Exceptional 12.1% |
| Immigrants | Chile | 98.6 /100 | #83 | Exceptional 12.1% |
| Immigrants | Czechoslovakia | 98.6 /100 | #84 | Exceptional 12.1% |