Apache vs Immigrants from Malaysia Ambulatory Disability
COMPARE
Apache
Immigrants from Malaysia
Ambulatory Disability
Ambulatory Disability Comparison
Apache
Immigrants from Malaysia
7.4%
AMBULATORY DISABILITY
0.0/ 100
METRIC RATING
321st/ 347
METRIC RANK
5.5%
AMBULATORY DISABILITY
100.0/ 100
METRIC RATING
36th/ 347
METRIC RANK
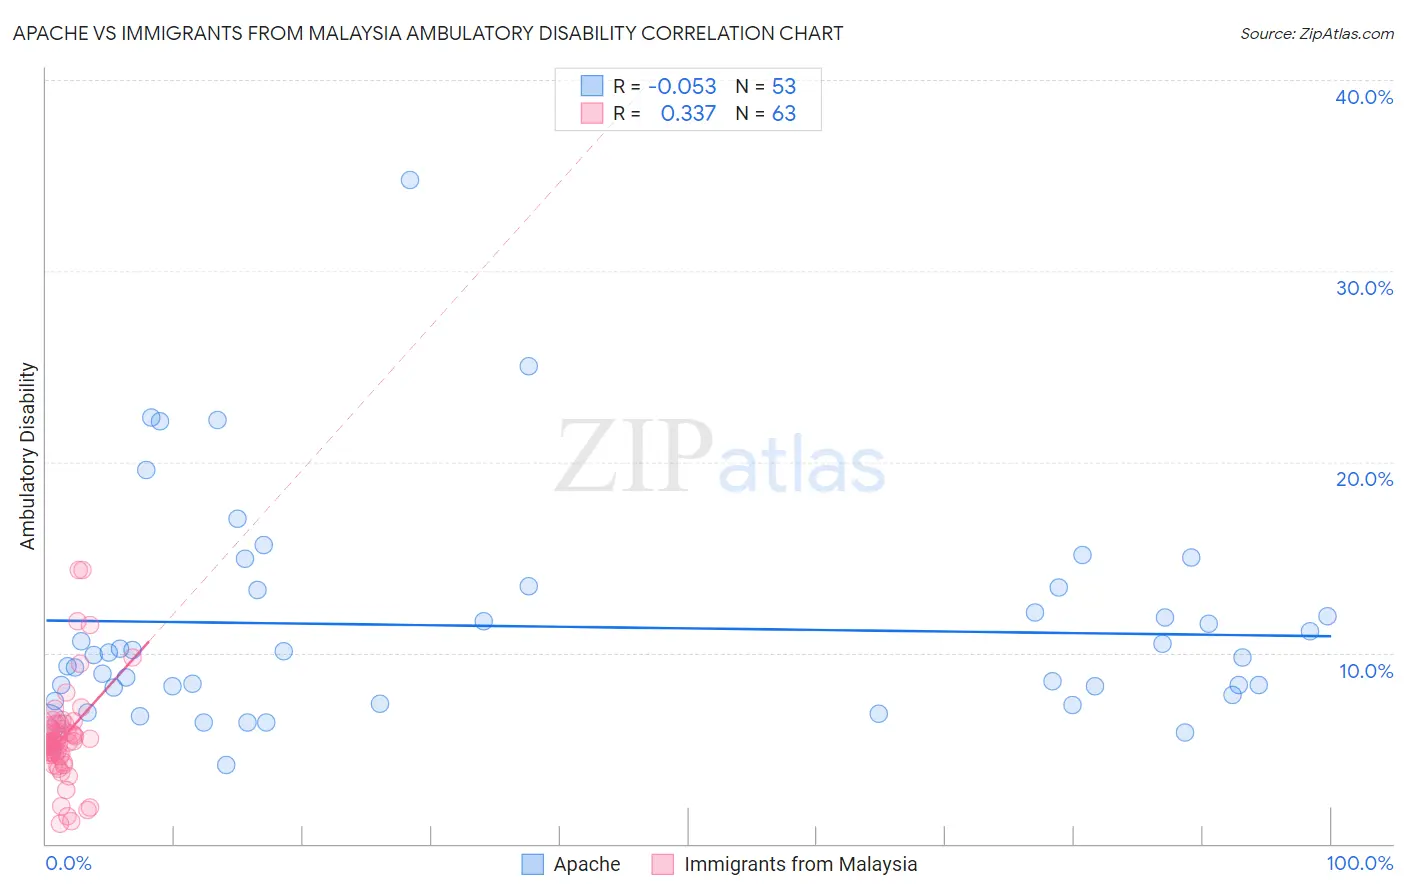
Apache vs Immigrants from Malaysia Ambulatory Disability Correlation Chart
The statistical analysis conducted on geographies consisting of 231,047,475 people shows a slight negative correlation between the proportion of Apache and percentage of population with ambulatory disability in the United States with a correlation coefficient (R) of -0.053 and weighted average of 7.4%. Similarly, the statistical analysis conducted on geographies consisting of 197,959,775 people shows a mild positive correlation between the proportion of Immigrants from Malaysia and percentage of population with ambulatory disability in the United States with a correlation coefficient (R) of 0.337 and weighted average of 5.5%, a difference of 34.7%.
Ambulatory Disability Correlation Summary
| Measurement | Apache | Immigrants from Malaysia |
| Minimum | 4.1% | 1.0% |
| Maximum | 34.8% | 14.4% |
| Range | 30.7% | 13.3% |
| Mean | 11.4% | 5.6% |
| Median | 9.9% | 5.3% |
| Interquartile 25% (IQ1) | 8.0% | 4.7% |
| Interquartile 75% (IQ3) | 13.4% | 6.1% |
| Interquartile Range (IQR) | 5.4% | 1.4% |
| Standard Deviation (Sample) | 5.7% | 2.6% |
| Standard Deviation (Population) | 5.6% | 2.5% |
Similar Demographics by Ambulatory Disability
Demographics Similar to Apache by Ambulatory Disability
In terms of ambulatory disability, the demographic groups most similar to Apache are Osage (7.4%, a difference of 0.14%), American (7.4%, a difference of 0.42%), Potawatomi (7.3%, a difference of 0.81%), Navajo (7.5%, a difference of 1.7%), and Comanche (7.5%, a difference of 1.8%).
| Demographics | Rating | Rank | Ambulatory Disability |
| Blackfeet | 0.0 /100 | #314 | Tragic 7.1% |
| Shoshone | 0.0 /100 | #315 | Tragic 7.1% |
| Immigrants | Dominican Republic | 0.0 /100 | #316 | Tragic 7.1% |
| Central American Indians | 0.0 /100 | #317 | Tragic 7.2% |
| Ottawa | 0.0 /100 | #318 | Tragic 7.2% |
| Dominicans | 0.0 /100 | #319 | Tragic 7.2% |
| Potawatomi | 0.0 /100 | #320 | Tragic 7.3% |
| Apache | 0.0 /100 | #321 | Tragic 7.4% |
| Osage | 0.0 /100 | #322 | Tragic 7.4% |
| Americans | 0.0 /100 | #323 | Tragic 7.4% |
| Navajo | 0.0 /100 | #324 | Tragic 7.5% |
| Comanche | 0.0 /100 | #325 | Tragic 7.5% |
| Blacks/African Americans | 0.0 /100 | #326 | Tragic 7.5% |
| Natives/Alaskans | 0.0 /100 | #327 | Tragic 7.5% |
| Hopi | 0.0 /100 | #328 | Tragic 7.6% |
Demographics Similar to Immigrants from Malaysia by Ambulatory Disability
In terms of ambulatory disability, the demographic groups most similar to Immigrants from Malaysia are Turkish (5.5%, a difference of 0.020%), Cypriot (5.5%, a difference of 0.020%), Afghan (5.5%, a difference of 0.070%), Immigrants from Asia (5.5%, a difference of 0.11%), and Immigrants from Eritrea (5.5%, a difference of 0.11%).
| Demographics | Rating | Rank | Ambulatory Disability |
| Immigrants | Iran | 100.0 /100 | #29 | Exceptional 5.4% |
| Immigrants | Turkey | 100.0 /100 | #30 | Exceptional 5.4% |
| Immigrants | Venezuela | 100.0 /100 | #31 | Exceptional 5.4% |
| Immigrants | Australia | 100.0 /100 | #32 | Exceptional 5.5% |
| Immigrants | Pakistan | 100.0 /100 | #33 | Exceptional 5.5% |
| Immigrants | Asia | 100.0 /100 | #34 | Exceptional 5.5% |
| Afghans | 100.0 /100 | #35 | Exceptional 5.5% |
| Immigrants | Malaysia | 100.0 /100 | #36 | Exceptional 5.5% |
| Turks | 100.0 /100 | #37 | Exceptional 5.5% |
| Cypriots | 100.0 /100 | #38 | Exceptional 5.5% |
| Immigrants | Eritrea | 100.0 /100 | #39 | Exceptional 5.5% |
| Venezuelans | 99.9 /100 | #40 | Exceptional 5.5% |
| Mongolians | 99.9 /100 | #41 | Exceptional 5.5% |
| Argentineans | 99.9 /100 | #42 | Exceptional 5.5% |
| Paraguayans | 99.9 /100 | #43 | Exceptional 5.5% |