Apache vs Japanese Single Male Poverty
COMPARE
Apache
Japanese
Single Male Poverty
Single Male Poverty Comparison
Apache
Japanese
21.6%
SINGLE MALE POVERTY
0.0/ 100
METRIC RATING
337th/ 347
METRIC RANK
13.1%
SINGLE MALE POVERTY
14.8/ 100
METRIC RATING
215th/ 347
METRIC RANK
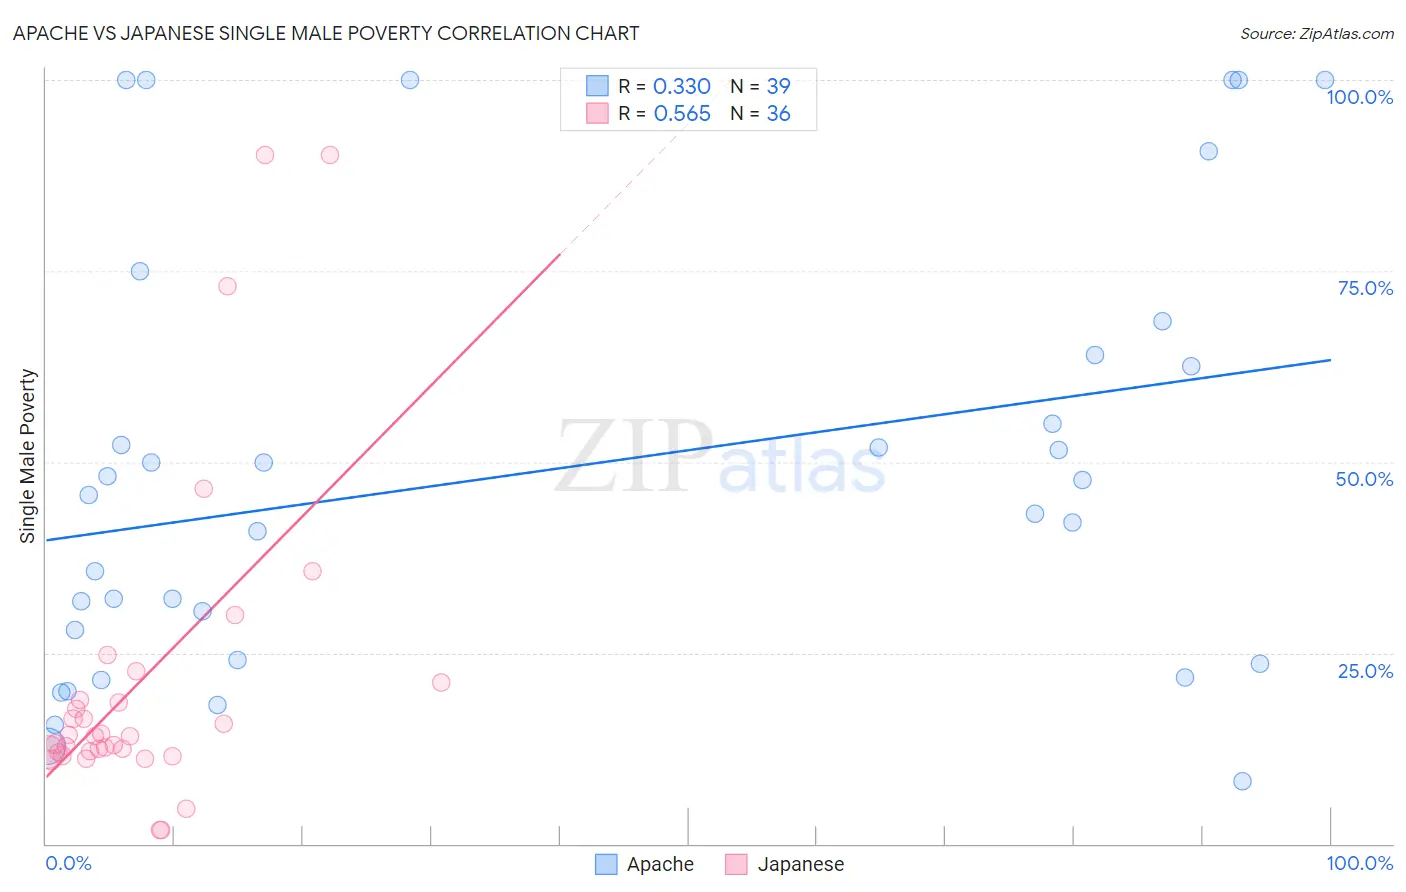
Apache vs Japanese Single Male Poverty Correlation Chart
The statistical analysis conducted on geographies consisting of 216,687,885 people shows a mild positive correlation between the proportion of Apache and poverty level among single males in the United States with a correlation coefficient (R) of 0.330 and weighted average of 21.6%. Similarly, the statistical analysis conducted on geographies consisting of 231,157,970 people shows a substantial positive correlation between the proportion of Japanese and poverty level among single males in the United States with a correlation coefficient (R) of 0.565 and weighted average of 13.1%, a difference of 64.8%.
Single Male Poverty Correlation Summary
| Measurement | Apache | Japanese |
| Minimum | 8.2% | 1.7% |
| Maximum | 100.0% | 90.1% |
| Range | 91.8% | 88.4% |
| Mean | 49.1% | 21.4% |
| Median | 45.6% | 14.1% |
| Interquartile 25% (IQ1) | 24.1% | 12.0% |
| Interquartile 75% (IQ3) | 64.0% | 20.0% |
| Interquartile Range (IQR) | 39.9% | 8.0% |
| Standard Deviation (Sample) | 28.3% | 21.1% |
| Standard Deviation (Population) | 27.9% | 20.8% |
Similar Demographics by Single Male Poverty
Demographics Similar to Apache by Single Male Poverty
In terms of single male poverty, the demographic groups most similar to Apache are Tohono O'odham (21.6%, a difference of 0.10%), Pueblo (21.6%, a difference of 0.18%), Yuman (21.3%, a difference of 1.3%), Arapaho (21.9%, a difference of 1.7%), and Sioux (22.2%, a difference of 2.9%).
| Demographics | Rating | Rank | Single Male Poverty |
| Cajuns | 0.0 /100 | #330 | Tragic 19.1% |
| Paiute | 0.0 /100 | #331 | Tragic 19.3% |
| Natives/Alaskans | 0.0 /100 | #332 | Tragic 19.6% |
| Inupiat | 0.0 /100 | #333 | Tragic 20.0% |
| Pima | 0.0 /100 | #334 | Tragic 20.2% |
| Yuman | 0.0 /100 | #335 | Tragic 21.3% |
| Tohono O'odham | 0.0 /100 | #336 | Tragic 21.6% |
| Apache | 0.0 /100 | #337 | Tragic 21.6% |
| Pueblo | 0.0 /100 | #338 | Tragic 21.6% |
| Arapaho | 0.0 /100 | #339 | Tragic 21.9% |
| Sioux | 0.0 /100 | #340 | Tragic 22.2% |
| Crow | 0.0 /100 | #341 | Tragic 23.3% |
| Houma | 0.0 /100 | #342 | Tragic 23.5% |
| Puerto Ricans | 0.0 /100 | #343 | Tragic 25.1% |
| Lumbee | 0.0 /100 | #344 | Tragic 25.2% |
Demographics Similar to Japanese by Single Male Poverty
In terms of single male poverty, the demographic groups most similar to Japanese are Zimbabwean (13.1%, a difference of 0.010%), Austrian (13.1%, a difference of 0.090%), Italian (13.1%, a difference of 0.11%), Senegalese (13.1%, a difference of 0.16%), and Swedish (13.1%, a difference of 0.19%).
| Demographics | Rating | Rank | Single Male Poverty |
| Immigrants | Western Africa | 17.6 /100 | #208 | Poor 13.1% |
| Mexican American Indians | 17.5 /100 | #209 | Poor 13.1% |
| Immigrants | Haiti | 16.8 /100 | #210 | Poor 13.1% |
| Swedes | 16.8 /100 | #211 | Poor 13.1% |
| Senegalese | 16.4 /100 | #212 | Poor 13.1% |
| Italians | 15.9 /100 | #213 | Poor 13.1% |
| Zimbabweans | 14.9 /100 | #214 | Poor 13.1% |
| Japanese | 14.8 /100 | #215 | Poor 13.1% |
| Austrians | 13.9 /100 | #216 | Poor 13.1% |
| Bermudans | 13.0 /100 | #217 | Poor 13.1% |
| Scandinavians | 12.9 /100 | #218 | Poor 13.1% |
| Immigrants | Burma/Myanmar | 12.6 /100 | #219 | Poor 13.1% |
| Central Americans | 10.9 /100 | #220 | Poor 13.2% |
| New Zealanders | 10.7 /100 | #221 | Poor 13.2% |
| Immigrants | Western Europe | 10.0 /100 | #222 | Poor 13.2% |