Apache vs Immigrants from Malaysia Vision Disability
COMPARE
Apache
Immigrants from Malaysia
Vision Disability
Vision Disability Comparison
Apache
Immigrants from Malaysia
3.0%
VISION DISABILITY
0.0/ 100
METRIC RATING
329th/ 347
METRIC RANK
1.9%
VISION DISABILITY
99.9/ 100
METRIC RATING
28th/ 347
METRIC RANK
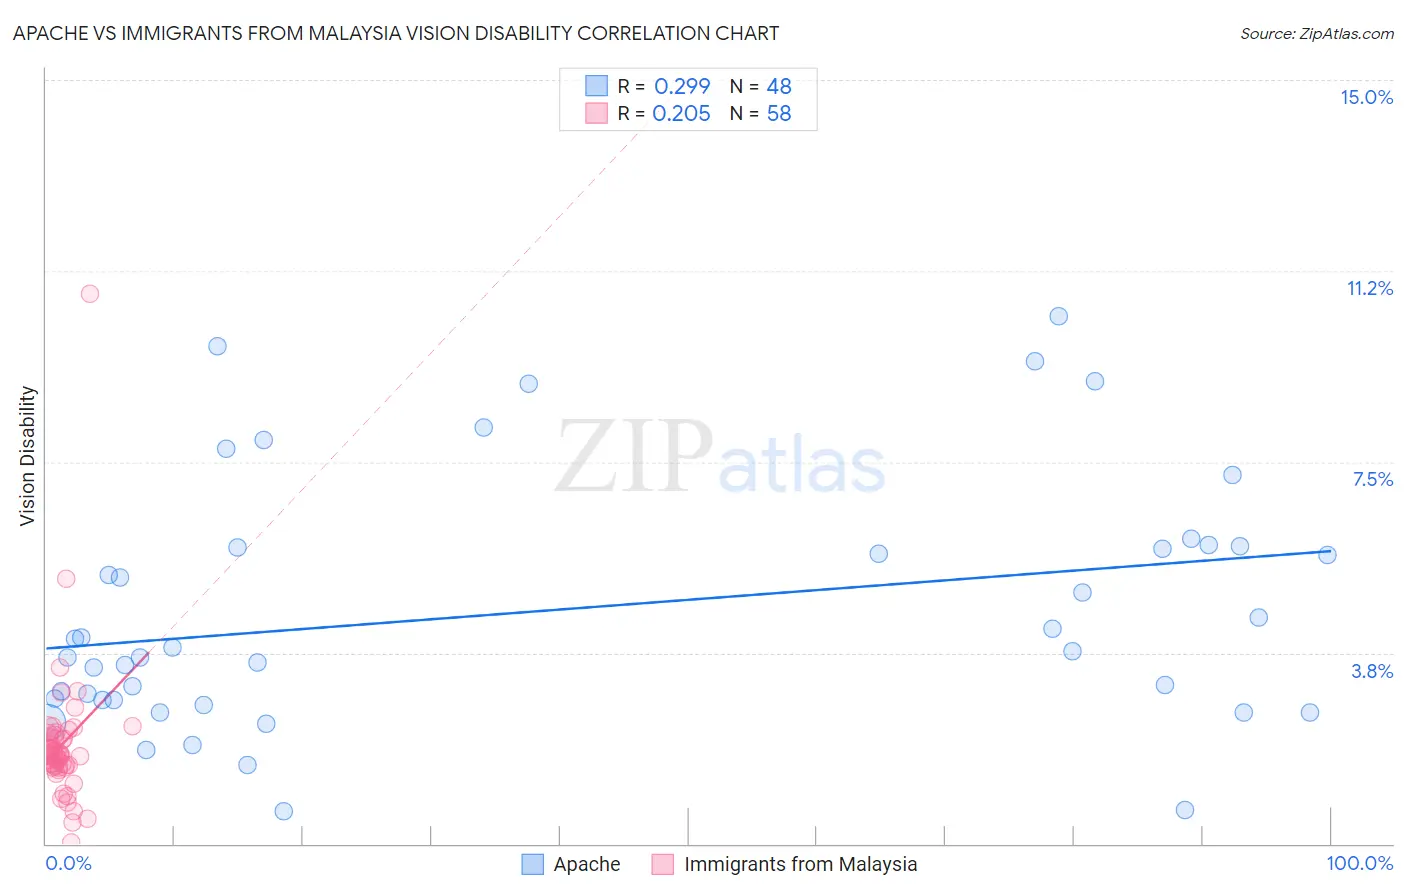
Apache vs Immigrants from Malaysia Vision Disability Correlation Chart
The statistical analysis conducted on geographies consisting of 231,003,425 people shows a weak positive correlation between the proportion of Apache and percentage of population with vision disability in the United States with a correlation coefficient (R) of 0.299 and weighted average of 3.0%. Similarly, the statistical analysis conducted on geographies consisting of 197,931,356 people shows a weak positive correlation between the proportion of Immigrants from Malaysia and percentage of population with vision disability in the United States with a correlation coefficient (R) of 0.205 and weighted average of 1.9%, a difference of 55.1%.
Vision Disability Correlation Summary
| Measurement | Apache | Immigrants from Malaysia |
| Minimum | 0.65% | 0.037% |
| Maximum | 10.4% | 10.8% |
| Range | 9.7% | 10.8% |
| Mean | 4.6% | 1.9% |
| Median | 3.8% | 1.7% |
| Interquartile 25% (IQ1) | 2.8% | 1.5% |
| Interquartile 75% (IQ3) | 5.8% | 2.1% |
| Interquartile Range (IQR) | 3.0% | 0.58% |
| Standard Deviation (Sample) | 2.5% | 1.4% |
| Standard Deviation (Population) | 2.4% | 1.4% |
Similar Demographics by Vision Disability
Demographics Similar to Apache by Vision Disability
In terms of vision disability, the demographic groups most similar to Apache are Yuman (3.0%, a difference of 0.19%), Native/Alaskan (3.0%, a difference of 0.74%), Colville (3.0%, a difference of 1.2%), Spanish American (2.9%, a difference of 1.5%), and Central American Indian (3.0%, a difference of 1.8%).
| Demographics | Rating | Rank | Vision Disability |
| Paiute | 0.0 /100 | #322 | Tragic 2.9% |
| Tlingit-Haida | 0.0 /100 | #323 | Tragic 2.9% |
| Hopi | 0.0 /100 | #324 | Tragic 2.9% |
| Cherokee | 0.0 /100 | #325 | Tragic 2.9% |
| Spanish Americans | 0.0 /100 | #326 | Tragic 2.9% |
| Natives/Alaskans | 0.0 /100 | #327 | Tragic 3.0% |
| Yuman | 0.0 /100 | #328 | Tragic 3.0% |
| Apache | 0.0 /100 | #329 | Tragic 3.0% |
| Colville | 0.0 /100 | #330 | Tragic 3.0% |
| Central American Indians | 0.0 /100 | #331 | Tragic 3.0% |
| Seminole | 0.0 /100 | #332 | Tragic 3.1% |
| Cajuns | 0.0 /100 | #333 | Tragic 3.1% |
| Cheyenne | 0.0 /100 | #334 | Tragic 3.1% |
| Navajo | 0.0 /100 | #335 | Tragic 3.1% |
| Alaskan Athabascans | 0.0 /100 | #336 | Tragic 3.1% |
Demographics Similar to Immigrants from Malaysia by Vision Disability
In terms of vision disability, the demographic groups most similar to Immigrants from Malaysia are Taiwanese (1.9%, a difference of 0.020%), Egyptian (1.9%, a difference of 0.070%), Immigrants from Nepal (1.9%, a difference of 0.11%), Mongolian (1.9%, a difference of 0.27%), and Immigrants from Japan (1.9%, a difference of 0.36%).
| Demographics | Rating | Rank | Vision Disability |
| Turks | 100.0 /100 | #21 | Exceptional 1.9% |
| Immigrants | Pakistan | 100.0 /100 | #22 | Exceptional 1.9% |
| Immigrants | Asia | 99.9 /100 | #23 | Exceptional 1.9% |
| Immigrants | Lithuania | 99.9 /100 | #24 | Exceptional 1.9% |
| Bulgarians | 99.9 /100 | #25 | Exceptional 1.9% |
| Immigrants | Japan | 99.9 /100 | #26 | Exceptional 1.9% |
| Taiwanese | 99.9 /100 | #27 | Exceptional 1.9% |
| Immigrants | Malaysia | 99.9 /100 | #28 | Exceptional 1.9% |
| Egyptians | 99.9 /100 | #29 | Exceptional 1.9% |
| Immigrants | Nepal | 99.9 /100 | #30 | Exceptional 1.9% |
| Mongolians | 99.9 /100 | #31 | Exceptional 1.9% |
| Luxembourgers | 99.9 /100 | #32 | Exceptional 1.9% |
| Immigrants | Egypt | 99.9 /100 | #33 | Exceptional 1.9% |
| Immigrants | Turkey | 99.8 /100 | #34 | Exceptional 1.9% |
| Immigrants | Australia | 99.8 /100 | #35 | Exceptional 1.9% |