Nigerian vs Immigrants from Chile Female Poverty
COMPARE
Nigerian
Immigrants from Chile
Female Poverty
Female Poverty Comparison
Nigerians
Immigrants from Chile
14.8%
FEMALE POVERTY
1.7/ 100
METRIC RATING
231st/ 347
METRIC RANK
13.3%
FEMALE POVERTY
57.4/ 100
METRIC RATING
167th/ 347
METRIC RANK
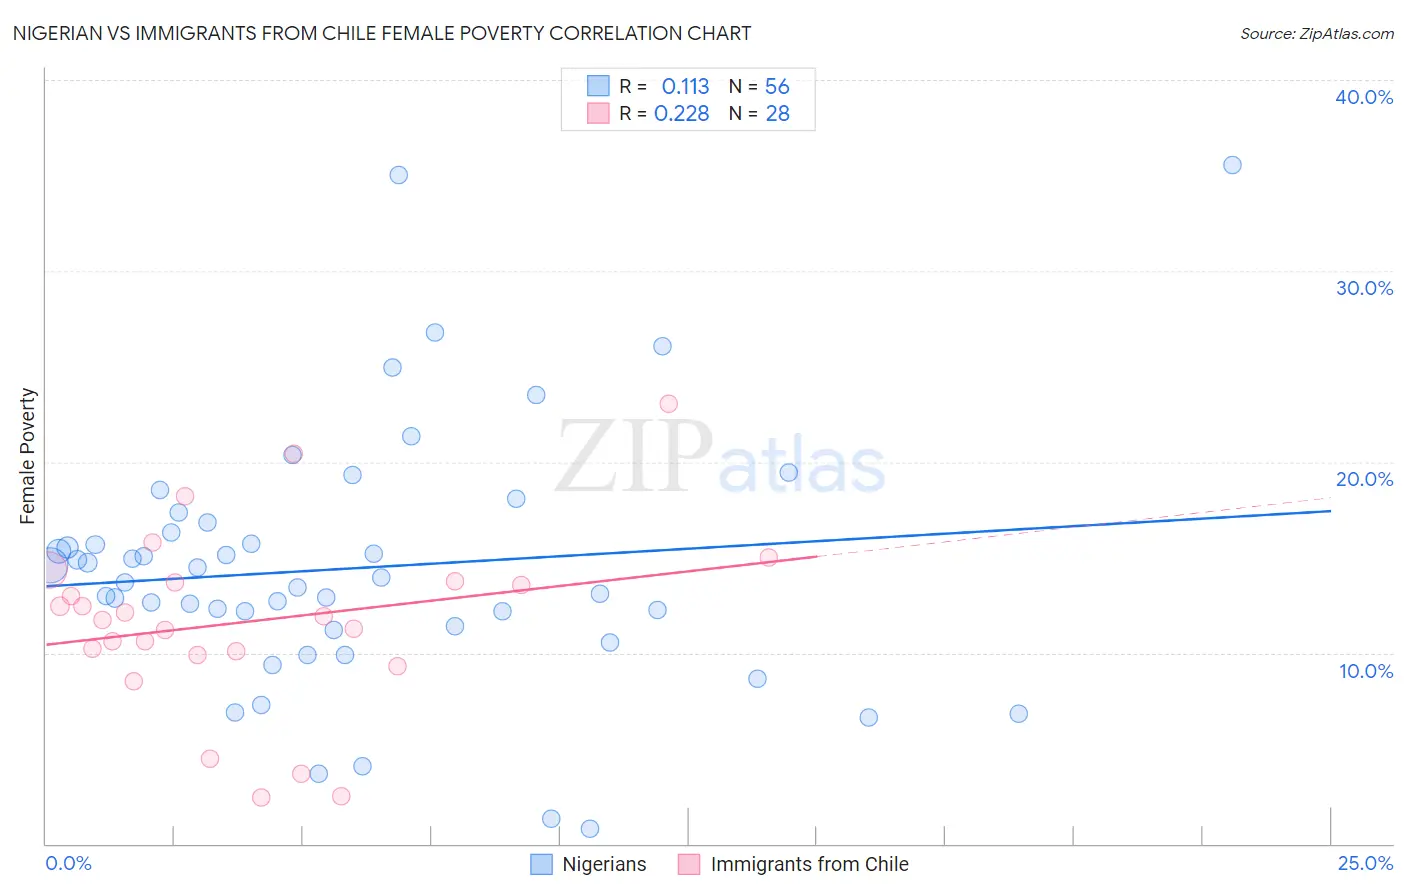
Nigerian vs Immigrants from Chile Female Poverty Correlation Chart
The statistical analysis conducted on geographies consisting of 332,444,319 people shows a poor positive correlation between the proportion of Nigerians and poverty level among females in the United States with a correlation coefficient (R) of 0.113 and weighted average of 14.8%. Similarly, the statistical analysis conducted on geographies consisting of 218,592,418 people shows a weak positive correlation between the proportion of Immigrants from Chile and poverty level among females in the United States with a correlation coefficient (R) of 0.228 and weighted average of 13.3%, a difference of 10.6%.
Female Poverty Correlation Summary
| Measurement | Nigerian | Immigrants from Chile |
| Minimum | 0.81% | 2.4% |
| Maximum | 35.6% | 23.0% |
| Range | 34.7% | 20.6% |
| Mean | 14.4% | 11.6% |
| Median | 13.8% | 11.8% |
| Interquartile 25% (IQ1) | 11.3% | 10.0% |
| Interquartile 75% (IQ3) | 16.6% | 13.7% |
| Interquartile Range (IQR) | 5.3% | 3.8% |
| Standard Deviation (Sample) | 6.8% | 4.8% |
| Standard Deviation (Population) | 6.7% | 4.7% |
Similar Demographics by Female Poverty
Demographics Similar to Nigerians by Female Poverty
In terms of female poverty, the demographic groups most similar to Nigerians are Alaska Native (14.7%, a difference of 0.10%), Ghanaian (14.7%, a difference of 0.30%), Osage (14.8%, a difference of 0.31%), German Russian (14.7%, a difference of 0.36%), and Immigrants from Saudi Arabia (14.8%, a difference of 0.41%).
| Demographics | Rating | Rank | Female Poverty |
| Americans | 2.8 /100 | #224 | Tragic 14.6% |
| Immigrants | Micronesia | 2.8 /100 | #225 | Tragic 14.6% |
| Immigrants | Eritrea | 2.4 /100 | #226 | Tragic 14.6% |
| Immigrants | Nigeria | 2.1 /100 | #227 | Tragic 14.7% |
| German Russians | 2.0 /100 | #228 | Tragic 14.7% |
| Ghanaians | 1.9 /100 | #229 | Tragic 14.7% |
| Alaska Natives | 1.8 /100 | #230 | Tragic 14.7% |
| Nigerians | 1.7 /100 | #231 | Tragic 14.8% |
| Osage | 1.5 /100 | #232 | Tragic 14.8% |
| Immigrants | Saudi Arabia | 1.4 /100 | #233 | Tragic 14.8% |
| Fijians | 1.1 /100 | #234 | Tragic 14.9% |
| Immigrants | Laos | 0.9 /100 | #235 | Tragic 15.0% |
| Cree | 0.7 /100 | #236 | Tragic 15.1% |
| French American Indians | 0.6 /100 | #237 | Tragic 15.1% |
| Immigrants | Armenia | 0.6 /100 | #238 | Tragic 15.1% |
Demographics Similar to Immigrants from Chile by Female Poverty
In terms of female poverty, the demographic groups most similar to Immigrants from Chile are Aleut (13.4%, a difference of 0.060%), Lebanese (13.4%, a difference of 0.14%), Colombian (13.4%, a difference of 0.16%), Immigrants from Oceania (13.3%, a difference of 0.24%), and White/Caucasian (13.4%, a difference of 0.27%).
| Demographics | Rating | Rank | Female Poverty |
| Immigrants | Nepal | 62.7 /100 | #160 | Good 13.3% |
| Immigrants | Ethiopia | 62.5 /100 | #161 | Good 13.3% |
| Guamanians/Chamorros | 62.4 /100 | #162 | Good 13.3% |
| Immigrants | Albania | 62.4 /100 | #163 | Good 13.3% |
| Ethiopians | 62.3 /100 | #164 | Good 13.3% |
| Scotch-Irish | 62.1 /100 | #165 | Good 13.3% |
| Immigrants | Oceania | 59.7 /100 | #166 | Average 13.3% |
| Immigrants | Chile | 57.4 /100 | #167 | Average 13.3% |
| Aleuts | 56.7 /100 | #168 | Average 13.4% |
| Lebanese | 55.9 /100 | #169 | Average 13.4% |
| Colombians | 55.7 /100 | #170 | Average 13.4% |
| Whites/Caucasians | 54.6 /100 | #171 | Average 13.4% |
| Mongolians | 53.6 /100 | #172 | Average 13.4% |
| Immigrants | Afghanistan | 50.8 /100 | #173 | Average 13.4% |
| Immigrants | Iraq | 50.0 /100 | #174 | Average 13.4% |