Chinese vs Immigrants from Chile Female Poverty
COMPARE
Chinese
Immigrants from Chile
Female Poverty
Female Poverty Comparison
Chinese
Immigrants from Chile
10.4%
FEMALE POVERTY
100.0/ 100
METRIC RATING
2nd/ 347
METRIC RANK
13.3%
FEMALE POVERTY
57.4/ 100
METRIC RATING
167th/ 347
METRIC RANK
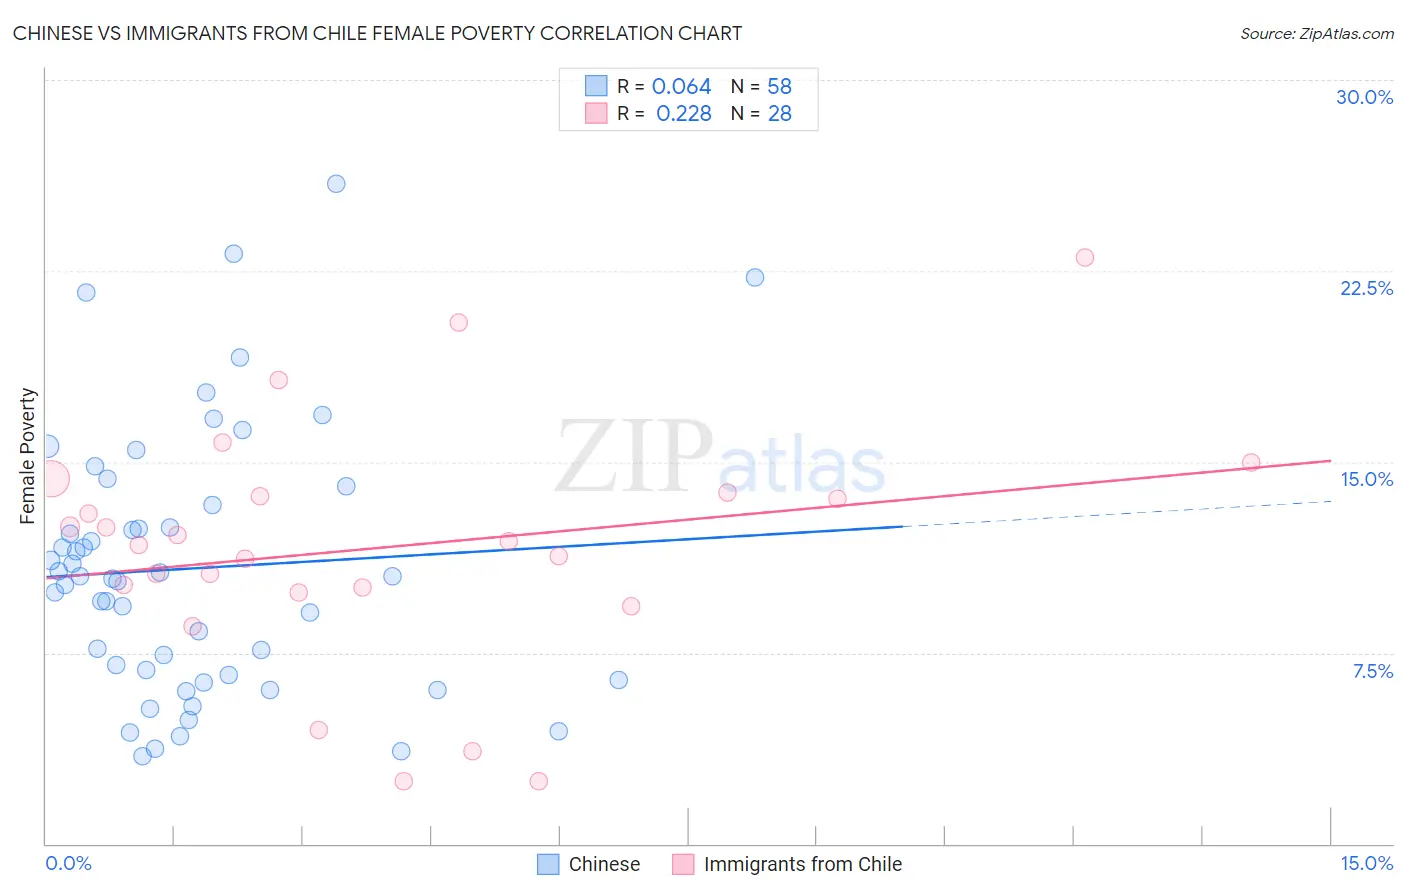
Chinese vs Immigrants from Chile Female Poverty Correlation Chart
The statistical analysis conducted on geographies consisting of 64,802,428 people shows a slight positive correlation between the proportion of Chinese and poverty level among females in the United States with a correlation coefficient (R) of 0.064 and weighted average of 10.4%. Similarly, the statistical analysis conducted on geographies consisting of 218,592,418 people shows a weak positive correlation between the proportion of Immigrants from Chile and poverty level among females in the United States with a correlation coefficient (R) of 0.228 and weighted average of 13.3%, a difference of 28.4%.
Female Poverty Correlation Summary
| Measurement | Chinese | Immigrants from Chile |
| Minimum | 3.4% | 2.4% |
| Maximum | 25.9% | 23.0% |
| Range | 22.5% | 20.6% |
| Mean | 10.8% | 11.6% |
| Median | 10.4% | 11.8% |
| Interquartile 25% (IQ1) | 6.6% | 10.0% |
| Interquartile 75% (IQ3) | 13.3% | 13.7% |
| Interquartile Range (IQR) | 6.7% | 3.8% |
| Standard Deviation (Sample) | 5.2% | 4.8% |
| Standard Deviation (Population) | 5.1% | 4.7% |
Similar Demographics by Female Poverty
Demographics Similar to Chinese by Female Poverty
In terms of female poverty, the demographic groups most similar to Chinese are Thai (10.5%, a difference of 0.65%), Immigrants from Taiwan (10.5%, a difference of 1.4%), Immigrants from India (9.9%, a difference of 5.2%), Filipino (10.9%, a difference of 5.4%), and Immigrants from Ireland (11.0%, a difference of 5.8%).
| Demographics | Rating | Rank | Female Poverty |
| Immigrants | India | 100.0 /100 | #1 | Exceptional 9.9% |
| Chinese | 100.0 /100 | #2 | Exceptional 10.4% |
| Thais | 100.0 /100 | #3 | Exceptional 10.5% |
| Immigrants | Taiwan | 100.0 /100 | #4 | Exceptional 10.5% |
| Filipinos | 100.0 /100 | #5 | Exceptional 10.9% |
| Immigrants | Ireland | 99.9 /100 | #6 | Exceptional 11.0% |
| Assyrians/Chaldeans/Syriacs | 99.9 /100 | #7 | Exceptional 11.0% |
| Immigrants | South Central Asia | 99.9 /100 | #8 | Exceptional 11.1% |
| Bulgarians | 99.9 /100 | #9 | Exceptional 11.1% |
| Immigrants | Hong Kong | 99.9 /100 | #10 | Exceptional 11.2% |
| Maltese | 99.9 /100 | #11 | Exceptional 11.2% |
| Bhutanese | 99.9 /100 | #12 | Exceptional 11.3% |
| Immigrants | Lithuania | 99.9 /100 | #13 | Exceptional 11.3% |
| Lithuanians | 99.8 /100 | #14 | Exceptional 11.4% |
| Latvians | 99.8 /100 | #15 | Exceptional 11.4% |
Demographics Similar to Immigrants from Chile by Female Poverty
In terms of female poverty, the demographic groups most similar to Immigrants from Chile are Aleut (13.4%, a difference of 0.060%), Lebanese (13.4%, a difference of 0.14%), Colombian (13.4%, a difference of 0.16%), Immigrants from Oceania (13.3%, a difference of 0.24%), and White/Caucasian (13.4%, a difference of 0.27%).
| Demographics | Rating | Rank | Female Poverty |
| Immigrants | Nepal | 62.7 /100 | #160 | Good 13.3% |
| Immigrants | Ethiopia | 62.5 /100 | #161 | Good 13.3% |
| Guamanians/Chamorros | 62.4 /100 | #162 | Good 13.3% |
| Immigrants | Albania | 62.4 /100 | #163 | Good 13.3% |
| Ethiopians | 62.3 /100 | #164 | Good 13.3% |
| Scotch-Irish | 62.1 /100 | #165 | Good 13.3% |
| Immigrants | Oceania | 59.7 /100 | #166 | Average 13.3% |
| Immigrants | Chile | 57.4 /100 | #167 | Average 13.3% |
| Aleuts | 56.7 /100 | #168 | Average 13.4% |
| Lebanese | 55.9 /100 | #169 | Average 13.4% |
| Colombians | 55.7 /100 | #170 | Average 13.4% |
| Whites/Caucasians | 54.6 /100 | #171 | Average 13.4% |
| Mongolians | 53.6 /100 | #172 | Average 13.4% |
| Immigrants | Afghanistan | 50.8 /100 | #173 | Average 13.4% |
| Immigrants | Iraq | 50.0 /100 | #174 | Average 13.4% |