Choctaw vs Immigrants from Barbados Male Poverty
COMPARE
Choctaw
Immigrants from Barbados
Male Poverty
Male Poverty Comparison
Choctaw
Immigrants from Barbados
14.4%
MALE POVERTY
0.0/ 100
METRIC RATING
312th/ 347
METRIC RANK
13.8%
MALE POVERTY
0.0/ 100
METRIC RATING
287th/ 347
METRIC RANK
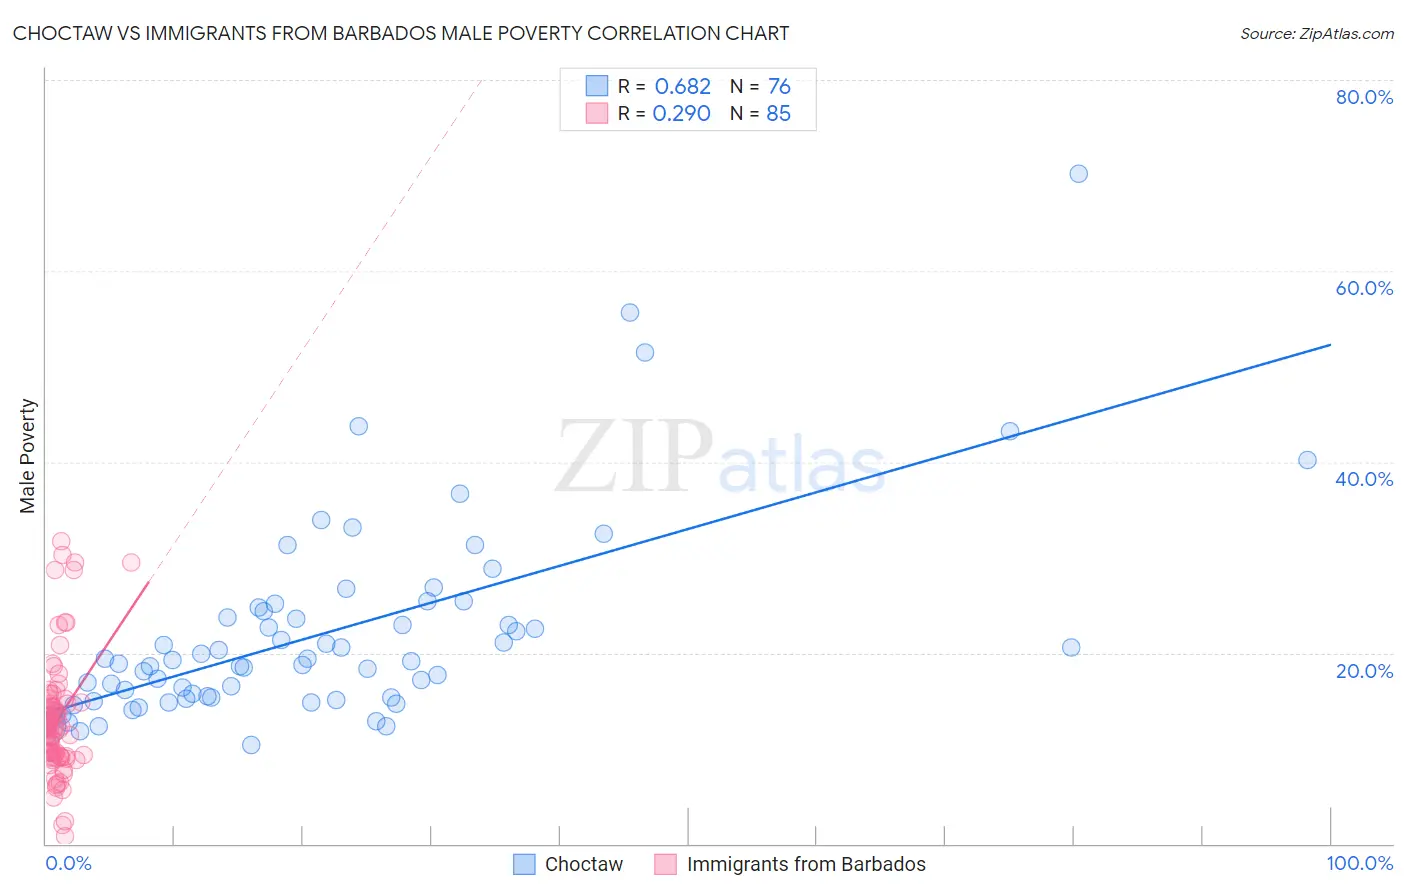
Choctaw vs Immigrants from Barbados Male Poverty Correlation Chart
The statistical analysis conducted on geographies consisting of 269,566,788 people shows a significant positive correlation between the proportion of Choctaw and poverty level among males in the United States with a correlation coefficient (R) of 0.682 and weighted average of 14.4%. Similarly, the statistical analysis conducted on geographies consisting of 112,769,360 people shows a weak positive correlation between the proportion of Immigrants from Barbados and poverty level among males in the United States with a correlation coefficient (R) of 0.290 and weighted average of 13.8%, a difference of 4.6%.
Male Poverty Correlation Summary
| Measurement | Choctaw | Immigrants from Barbados |
| Minimum | 10.4% | 0.81% |
| Maximum | 70.2% | 31.7% |
| Range | 59.8% | 30.9% |
| Mean | 22.2% | 13.0% |
| Median | 19.2% | 12.0% |
| Interquartile 25% (IQ1) | 15.3% | 9.1% |
| Interquartile 75% (IQ3) | 24.6% | 14.7% |
| Interquartile Range (IQR) | 9.3% | 5.6% |
| Standard Deviation (Sample) | 10.5% | 6.3% |
| Standard Deviation (Population) | 10.5% | 6.2% |
Similar Demographics by Male Poverty
Demographics Similar to Choctaw by Male Poverty
In terms of male poverty, the demographic groups most similar to Choctaw are Honduran (14.3%, a difference of 0.47%), Seminole (14.3%, a difference of 0.67%), Somali (14.3%, a difference of 0.88%), African (14.2%, a difference of 1.3%), and Dutch West Indian (14.2%, a difference of 1.3%).
| Demographics | Rating | Rank | Male Poverty |
| Immigrants | Bangladesh | 0.0 /100 | #305 | Tragic 14.1% |
| Creek | 0.0 /100 | #306 | Tragic 14.1% |
| Dutch West Indians | 0.0 /100 | #307 | Tragic 14.2% |
| Africans | 0.0 /100 | #308 | Tragic 14.2% |
| Somalis | 0.0 /100 | #309 | Tragic 14.3% |
| Seminole | 0.0 /100 | #310 | Tragic 14.3% |
| Hondurans | 0.0 /100 | #311 | Tragic 14.3% |
| Choctaw | 0.0 /100 | #312 | Tragic 14.4% |
| Immigrants | Somalia | 0.0 /100 | #313 | Tragic 14.6% |
| Immigrants | Honduras | 0.0 /100 | #314 | Tragic 14.6% |
| Chippewa | 0.0 /100 | #315 | Tragic 14.6% |
| British West Indians | 0.0 /100 | #316 | Tragic 14.6% |
| Immigrants | Dominica | 0.0 /100 | #317 | Tragic 14.7% |
| Immigrants | Grenada | 0.0 /100 | #318 | Tragic 14.7% |
| U.S. Virgin Islanders | 0.0 /100 | #319 | Tragic 14.7% |
Demographics Similar to Immigrants from Barbados by Male Poverty
In terms of male poverty, the demographic groups most similar to Immigrants from Barbados are Shoshone (13.8%, a difference of 0.020%), West Indian (13.8%, a difference of 0.050%), Immigrants from Haiti (13.8%, a difference of 0.060%), Comanche (13.8%, a difference of 0.070%), and Immigrants from St. Vincent and the Grenadines (13.8%, a difference of 0.17%).
| Demographics | Rating | Rank | Male Poverty |
| Mexicans | 0.0 /100 | #280 | Tragic 13.7% |
| Yaqui | 0.0 /100 | #281 | Tragic 13.7% |
| Immigrants | Cabo Verde | 0.0 /100 | #282 | Tragic 13.7% |
| Comanche | 0.0 /100 | #283 | Tragic 13.8% |
| Immigrants | Haiti | 0.0 /100 | #284 | Tragic 13.8% |
| West Indians | 0.0 /100 | #285 | Tragic 13.8% |
| Shoshone | 0.0 /100 | #286 | Tragic 13.8% |
| Immigrants | Barbados | 0.0 /100 | #287 | Tragic 13.8% |
| Immigrants | St. Vincent and the Grenadines | 0.0 /100 | #288 | Tragic 13.8% |
| Guatemalans | 0.0 /100 | #289 | Tragic 13.8% |
| Immigrants | Zaire | 0.0 /100 | #290 | Tragic 13.8% |
| Vietnamese | 0.0 /100 | #291 | Tragic 13.8% |
| Indonesians | 0.0 /100 | #292 | Tragic 13.8% |
| Immigrants | Belize | 0.0 /100 | #293 | Tragic 13.8% |
| Hispanics or Latinos | 0.0 /100 | #294 | Tragic 13.9% |