Apache vs Immigrants from Nepal Male Poverty
COMPARE
Apache
Immigrants from Nepal
Male Poverty
Male Poverty Comparison
Apache
Immigrants from Nepal
17.7%
MALE POVERTY
0.0/ 100
METRIC RATING
335th/ 347
METRIC RANK
11.0%
MALE POVERTY
67.3/ 100
METRIC RATING
152nd/ 347
METRIC RANK
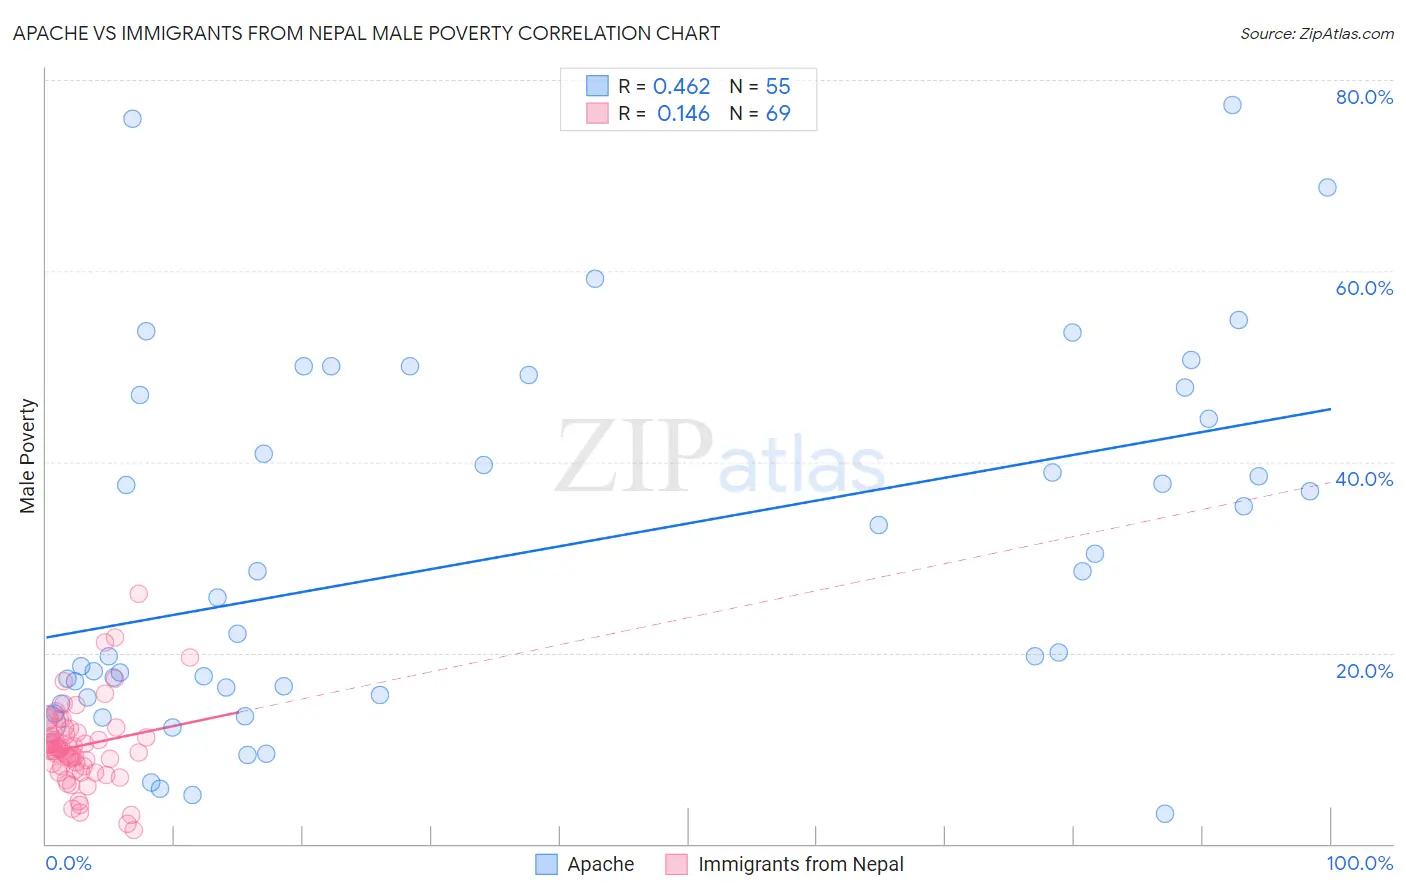
Apache vs Immigrants from Nepal Male Poverty Correlation Chart
The statistical analysis conducted on geographies consisting of 231,014,108 people shows a moderate positive correlation between the proportion of Apache and poverty level among males in the United States with a correlation coefficient (R) of 0.462 and weighted average of 17.7%. Similarly, the statistical analysis conducted on geographies consisting of 186,636,323 people shows a poor positive correlation between the proportion of Immigrants from Nepal and poverty level among males in the United States with a correlation coefficient (R) of 0.146 and weighted average of 11.0%, a difference of 60.8%.
Male Poverty Correlation Summary
| Measurement | Apache | Immigrants from Nepal |
| Minimum | 3.1% | 1.5% |
| Maximum | 77.3% | 26.3% |
| Range | 74.2% | 24.7% |
| Mean | 30.4% | 10.3% |
| Median | 25.8% | 9.9% |
| Interquartile 25% (IQ1) | 15.6% | 7.9% |
| Interquartile 75% (IQ3) | 47.0% | 11.9% |
| Interquartile Range (IQR) | 31.5% | 4.0% |
| Standard Deviation (Sample) | 18.8% | 4.4% |
| Standard Deviation (Population) | 18.6% | 4.4% |
Similar Demographics by Male Poverty
Demographics Similar to Apache by Male Poverty
In terms of male poverty, the demographic groups most similar to Apache are Cheyenne (17.6%, a difference of 0.20%), Native/Alaskan (16.9%, a difference of 4.4%), Pueblo (18.5%, a difference of 4.8%), Houma (16.7%, a difference of 5.7%), and Sioux (18.7%, a difference of 5.9%).
| Demographics | Rating | Rank | Male Poverty |
| Blacks/African Americans | 0.0 /100 | #328 | Tragic 15.8% |
| Dominicans | 0.0 /100 | #329 | Tragic 16.1% |
| Immigrants | Dominican Republic | 0.0 /100 | #330 | Tragic 16.2% |
| Ute | 0.0 /100 | #331 | Tragic 16.2% |
| Houma | 0.0 /100 | #332 | Tragic 16.7% |
| Natives/Alaskans | 0.0 /100 | #333 | Tragic 16.9% |
| Cheyenne | 0.0 /100 | #334 | Tragic 17.6% |
| Apache | 0.0 /100 | #335 | Tragic 17.7% |
| Pueblo | 0.0 /100 | #336 | Tragic 18.5% |
| Sioux | 0.0 /100 | #337 | Tragic 18.7% |
| Crow | 0.0 /100 | #338 | Tragic 19.1% |
| Yuman | 0.0 /100 | #339 | Tragic 19.5% |
| Immigrants | Yemen | 0.0 /100 | #340 | Tragic 20.1% |
| Lumbee | 0.0 /100 | #341 | Tragic 20.2% |
| Pima | 0.0 /100 | #342 | Tragic 20.4% |
Demographics Similar to Immigrants from Nepal by Male Poverty
In terms of male poverty, the demographic groups most similar to Immigrants from Nepal are Venezuelan (11.0%, a difference of 0.0%), Guamanian/Chamorro (11.0%, a difference of 0.030%), Immigrants from Venezuela (11.0%, a difference of 0.070%), Armenian (11.0%, a difference of 0.080%), and Icelander (11.0%, a difference of 0.14%).
| Demographics | Rating | Rank | Male Poverty |
| Immigrants | Germany | 71.6 /100 | #145 | Good 10.9% |
| Syrians | 71.4 /100 | #146 | Good 10.9% |
| Icelanders | 68.5 /100 | #147 | Good 11.0% |
| Armenians | 68.0 /100 | #148 | Good 11.0% |
| Immigrants | Venezuela | 67.9 /100 | #149 | Good 11.0% |
| Guamanians/Chamorros | 67.6 /100 | #150 | Good 11.0% |
| Venezuelans | 67.4 /100 | #151 | Good 11.0% |
| Immigrants | Nepal | 67.3 /100 | #152 | Good 11.0% |
| Immigrants | Bosnia and Herzegovina | 65.2 /100 | #153 | Good 11.0% |
| Immigrants | Kazakhstan | 64.8 /100 | #154 | Good 11.0% |
| Immigrants | Malaysia | 64.7 /100 | #155 | Good 11.0% |
| Costa Ricans | 63.9 /100 | #156 | Good 11.0% |
| Scotch-Irish | 63.7 /100 | #157 | Good 11.0% |
| Colombians | 63.0 /100 | #158 | Good 11.0% |
| Taiwanese | 62.7 /100 | #159 | Good 11.0% |