Immigrants from Serbia vs Immigrants from Barbados Male Poverty
COMPARE
Immigrants from Serbia
Immigrants from Barbados
Male Poverty
Male Poverty Comparison
Immigrants from Serbia
Immigrants from Barbados
10.0%
MALE POVERTY
98.9/ 100
METRIC RATING
45th/ 347
METRIC RANK
13.8%
MALE POVERTY
0.0/ 100
METRIC RATING
287th/ 347
METRIC RANK
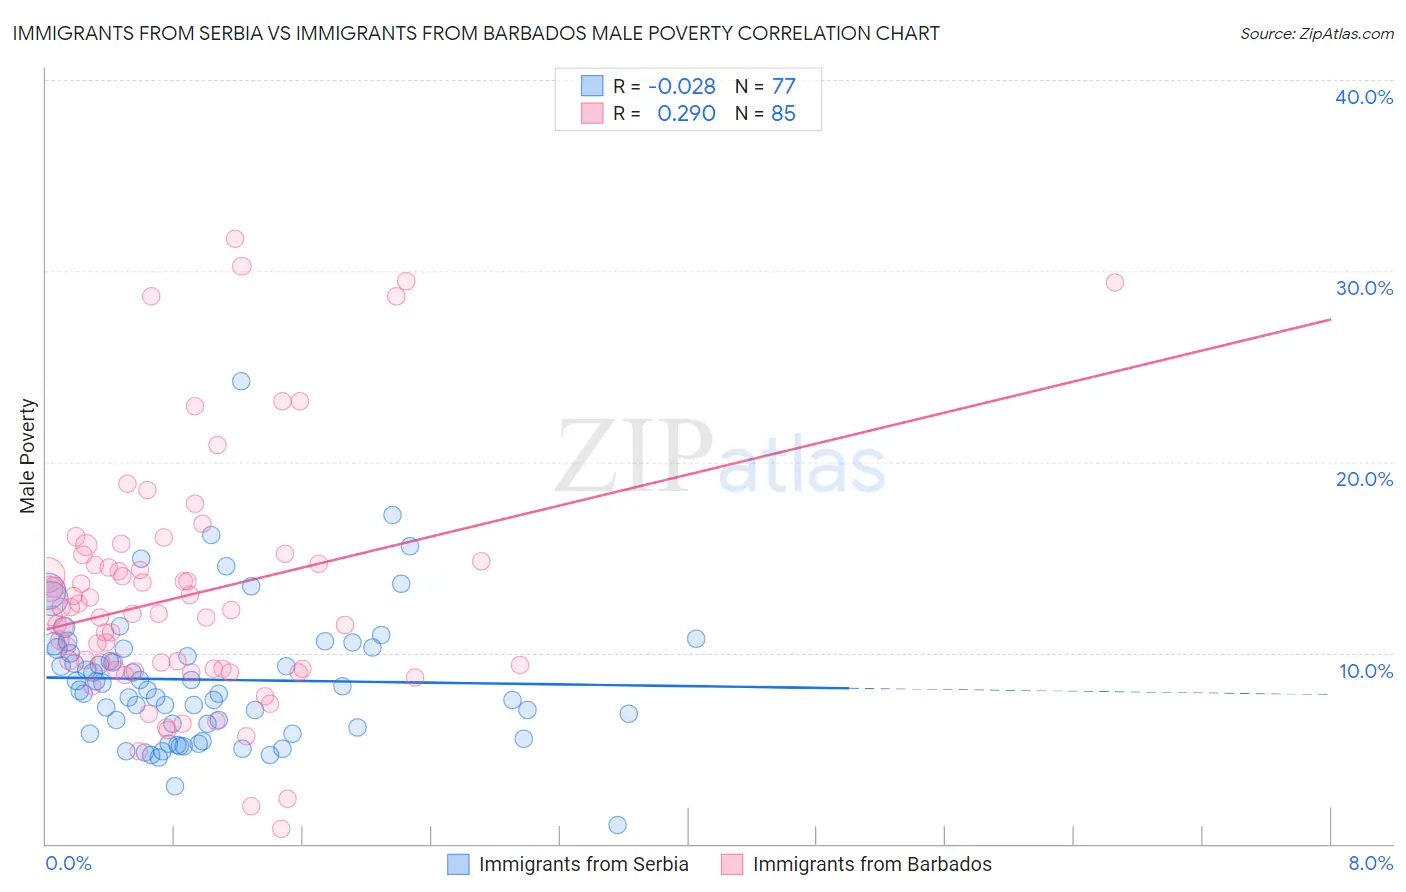
Immigrants from Serbia vs Immigrants from Barbados Male Poverty Correlation Chart
The statistical analysis conducted on geographies consisting of 131,714,857 people shows no correlation between the proportion of Immigrants from Serbia and poverty level among males in the United States with a correlation coefficient (R) of -0.028 and weighted average of 10.0%. Similarly, the statistical analysis conducted on geographies consisting of 112,769,360 people shows a weak positive correlation between the proportion of Immigrants from Barbados and poverty level among males in the United States with a correlation coefficient (R) of 0.290 and weighted average of 13.8%, a difference of 38.1%.
Male Poverty Correlation Summary
| Measurement | Immigrants from Serbia | Immigrants from Barbados |
| Minimum | 1.0% | 0.81% |
| Maximum | 24.2% | 31.7% |
| Range | 23.2% | 30.9% |
| Mean | 8.6% | 13.0% |
| Median | 8.1% | 12.0% |
| Interquartile 25% (IQ1) | 5.9% | 9.1% |
| Interquartile 75% (IQ3) | 10.3% | 14.7% |
| Interquartile Range (IQR) | 4.3% | 5.6% |
| Standard Deviation (Sample) | 3.6% | 6.3% |
| Standard Deviation (Population) | 3.6% | 6.2% |
Similar Demographics by Male Poverty
Demographics Similar to Immigrants from Serbia by Male Poverty
In terms of male poverty, the demographic groups most similar to Immigrants from Serbia are Turkish (10.0%, a difference of 0.020%), Immigrants from Singapore (10.0%, a difference of 0.15%), Immigrants from Japan (10.0%, a difference of 0.15%), Immigrants from Romania (9.9%, a difference of 0.18%), and Slovene (10.0%, a difference of 0.24%).
| Demographics | Rating | Rank | Male Poverty |
| Immigrants | Pakistan | 99.2 /100 | #38 | Exceptional 9.9% |
| Russians | 99.2 /100 | #39 | Exceptional 9.9% |
| Cypriots | 99.2 /100 | #40 | Exceptional 9.9% |
| Koreans | 99.2 /100 | #41 | Exceptional 9.9% |
| Immigrants | Iran | 99.1 /100 | #42 | Exceptional 9.9% |
| Immigrants | Moldova | 99.0 /100 | #43 | Exceptional 9.9% |
| Immigrants | Romania | 98.9 /100 | #44 | Exceptional 9.9% |
| Immigrants | Serbia | 98.9 /100 | #45 | Exceptional 10.0% |
| Turks | 98.9 /100 | #46 | Exceptional 10.0% |
| Immigrants | Singapore | 98.8 /100 | #47 | Exceptional 10.0% |
| Immigrants | Japan | 98.8 /100 | #48 | Exceptional 10.0% |
| Slovenes | 98.8 /100 | #49 | Exceptional 10.0% |
| Immigrants | Philippines | 98.7 /100 | #50 | Exceptional 10.0% |
| Immigrants | Croatia | 98.7 /100 | #51 | Exceptional 10.0% |
| Asians | 98.7 /100 | #52 | Exceptional 10.0% |
Demographics Similar to Immigrants from Barbados by Male Poverty
In terms of male poverty, the demographic groups most similar to Immigrants from Barbados are Shoshone (13.8%, a difference of 0.020%), West Indian (13.8%, a difference of 0.050%), Immigrants from Haiti (13.8%, a difference of 0.060%), Comanche (13.8%, a difference of 0.070%), and Immigrants from St. Vincent and the Grenadines (13.8%, a difference of 0.17%).
| Demographics | Rating | Rank | Male Poverty |
| Mexicans | 0.0 /100 | #280 | Tragic 13.7% |
| Yaqui | 0.0 /100 | #281 | Tragic 13.7% |
| Immigrants | Cabo Verde | 0.0 /100 | #282 | Tragic 13.7% |
| Comanche | 0.0 /100 | #283 | Tragic 13.8% |
| Immigrants | Haiti | 0.0 /100 | #284 | Tragic 13.8% |
| West Indians | 0.0 /100 | #285 | Tragic 13.8% |
| Shoshone | 0.0 /100 | #286 | Tragic 13.8% |
| Immigrants | Barbados | 0.0 /100 | #287 | Tragic 13.8% |
| Immigrants | St. Vincent and the Grenadines | 0.0 /100 | #288 | Tragic 13.8% |
| Guatemalans | 0.0 /100 | #289 | Tragic 13.8% |
| Immigrants | Zaire | 0.0 /100 | #290 | Tragic 13.8% |
| Vietnamese | 0.0 /100 | #291 | Tragic 13.8% |
| Indonesians | 0.0 /100 | #292 | Tragic 13.8% |
| Immigrants | Belize | 0.0 /100 | #293 | Tragic 13.8% |
| Hispanics or Latinos | 0.0 /100 | #294 | Tragic 13.9% |