Immigrants from Lithuania vs Immigrants from Barbados Male Poverty
COMPARE
Immigrants from Lithuania
Immigrants from Barbados
Male Poverty
Male Poverty Comparison
Immigrants from Lithuania
Immigrants from Barbados
9.4%
MALE POVERTY
99.9/ 100
METRIC RATING
13th/ 347
METRIC RANK
13.8%
MALE POVERTY
0.0/ 100
METRIC RATING
287th/ 347
METRIC RANK
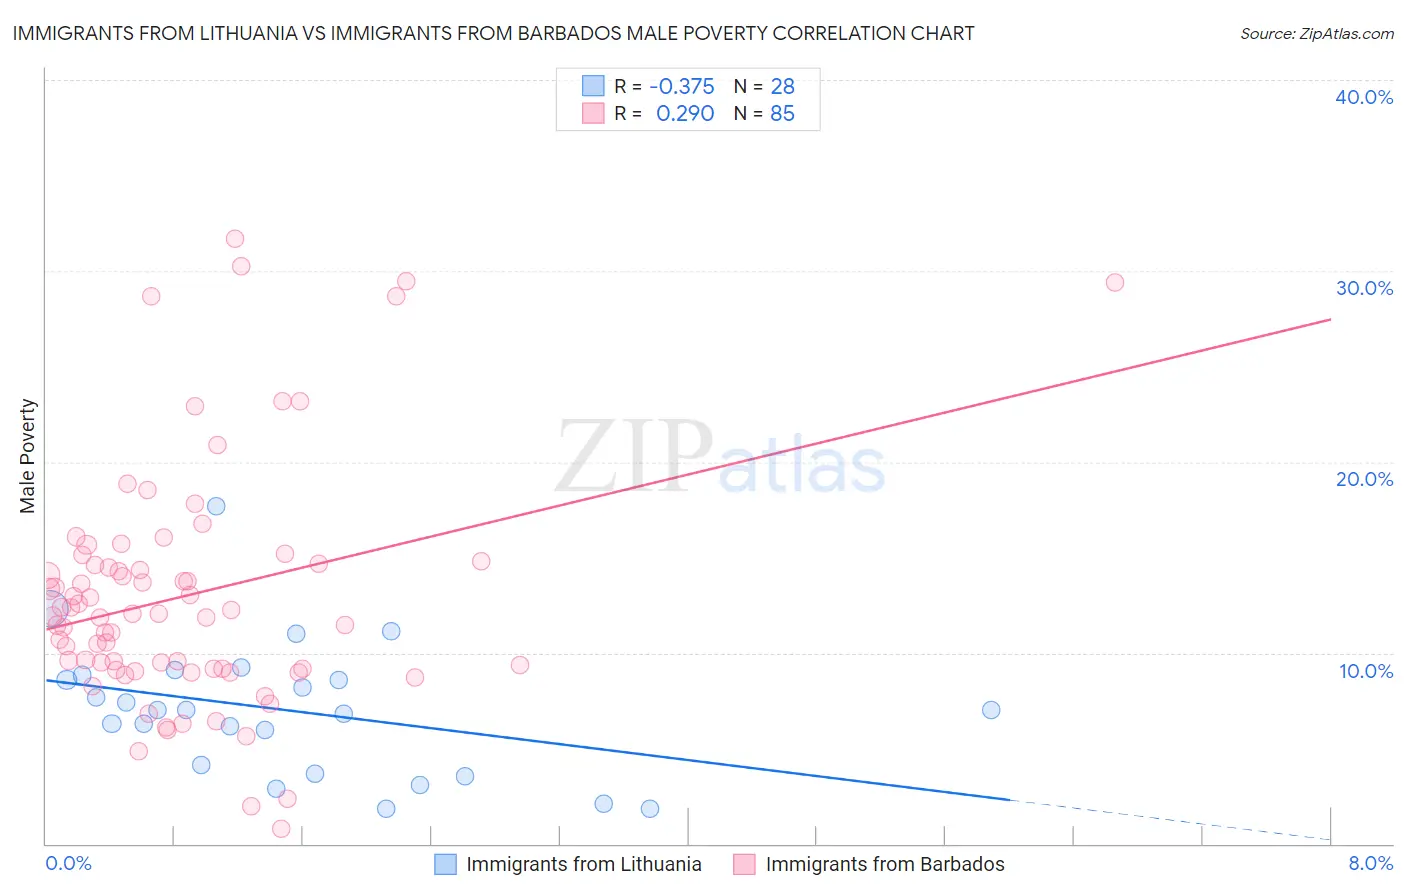
Immigrants from Lithuania vs Immigrants from Barbados Male Poverty Correlation Chart
The statistical analysis conducted on geographies consisting of 117,705,146 people shows a mild negative correlation between the proportion of Immigrants from Lithuania and poverty level among males in the United States with a correlation coefficient (R) of -0.375 and weighted average of 9.4%. Similarly, the statistical analysis conducted on geographies consisting of 112,769,360 people shows a weak positive correlation between the proportion of Immigrants from Barbados and poverty level among males in the United States with a correlation coefficient (R) of 0.290 and weighted average of 13.8%, a difference of 46.4%.
Male Poverty Correlation Summary
| Measurement | Immigrants from Lithuania | Immigrants from Barbados |
| Minimum | 1.8% | 0.81% |
| Maximum | 17.6% | 31.7% |
| Range | 15.8% | 30.9% |
| Mean | 7.0% | 13.0% |
| Median | 7.0% | 12.0% |
| Interquartile 25% (IQ1) | 3.9% | 9.1% |
| Interquartile 75% (IQ3) | 8.7% | 14.7% |
| Interquartile Range (IQR) | 4.8% | 5.6% |
| Standard Deviation (Sample) | 3.5% | 6.3% |
| Standard Deviation (Population) | 3.5% | 6.2% |
Similar Demographics by Male Poverty
Demographics Similar to Immigrants from Lithuania by Male Poverty
In terms of male poverty, the demographic groups most similar to Immigrants from Lithuania are Immigrants from Bolivia (9.4%, a difference of 0.12%), Bolivian (9.4%, a difference of 0.17%), Immigrants from North Macedonia (9.4%, a difference of 0.38%), Bhutanese (9.5%, a difference of 0.67%), and Bulgarian (9.3%, a difference of 0.82%).
| Demographics | Rating | Rank | Male Poverty |
| Assyrians/Chaldeans/Syriacs | 99.9 /100 | #6 | Exceptional 9.1% |
| Immigrants | Ireland | 99.9 /100 | #7 | Exceptional 9.1% |
| Filipinos | 99.9 /100 | #8 | Exceptional 9.2% |
| Immigrants | South Central Asia | 99.9 /100 | #9 | Exceptional 9.3% |
| Bulgarians | 99.9 /100 | #10 | Exceptional 9.3% |
| Bolivians | 99.9 /100 | #11 | Exceptional 9.4% |
| Immigrants | Bolivia | 99.9 /100 | #12 | Exceptional 9.4% |
| Immigrants | Lithuania | 99.9 /100 | #13 | Exceptional 9.4% |
| Immigrants | North Macedonia | 99.8 /100 | #14 | Exceptional 9.4% |
| Bhutanese | 99.8 /100 | #15 | Exceptional 9.5% |
| Luxembourgers | 99.8 /100 | #16 | Exceptional 9.5% |
| Norwegians | 99.8 /100 | #17 | Exceptional 9.5% |
| Lithuanians | 99.8 /100 | #18 | Exceptional 9.5% |
| Immigrants | Hong Kong | 99.7 /100 | #19 | Exceptional 9.6% |
| Latvians | 99.7 /100 | #20 | Exceptional 9.6% |
Demographics Similar to Immigrants from Barbados by Male Poverty
In terms of male poverty, the demographic groups most similar to Immigrants from Barbados are Shoshone (13.8%, a difference of 0.020%), West Indian (13.8%, a difference of 0.050%), Immigrants from Haiti (13.8%, a difference of 0.060%), Comanche (13.8%, a difference of 0.070%), and Immigrants from St. Vincent and the Grenadines (13.8%, a difference of 0.17%).
| Demographics | Rating | Rank | Male Poverty |
| Mexicans | 0.0 /100 | #280 | Tragic 13.7% |
| Yaqui | 0.0 /100 | #281 | Tragic 13.7% |
| Immigrants | Cabo Verde | 0.0 /100 | #282 | Tragic 13.7% |
| Comanche | 0.0 /100 | #283 | Tragic 13.8% |
| Immigrants | Haiti | 0.0 /100 | #284 | Tragic 13.8% |
| West Indians | 0.0 /100 | #285 | Tragic 13.8% |
| Shoshone | 0.0 /100 | #286 | Tragic 13.8% |
| Immigrants | Barbados | 0.0 /100 | #287 | Tragic 13.8% |
| Immigrants | St. Vincent and the Grenadines | 0.0 /100 | #288 | Tragic 13.8% |
| Guatemalans | 0.0 /100 | #289 | Tragic 13.8% |
| Immigrants | Zaire | 0.0 /100 | #290 | Tragic 13.8% |
| Vietnamese | 0.0 /100 | #291 | Tragic 13.8% |
| Indonesians | 0.0 /100 | #292 | Tragic 13.8% |
| Immigrants | Belize | 0.0 /100 | #293 | Tragic 13.8% |
| Hispanics or Latinos | 0.0 /100 | #294 | Tragic 13.9% |