African vs Creek Single Father Poverty
COMPARE
African
Creek
Single Father Poverty
Single Father Poverty Comparison
Africans
Creek
18.3%
SINGLE FATHER POVERTY
0.0/ 100
METRIC RATING
298th/ 347
METRIC RANK
19.8%
SINGLE FATHER POVERTY
0.0/ 100
METRIC RATING
322nd/ 347
METRIC RANK
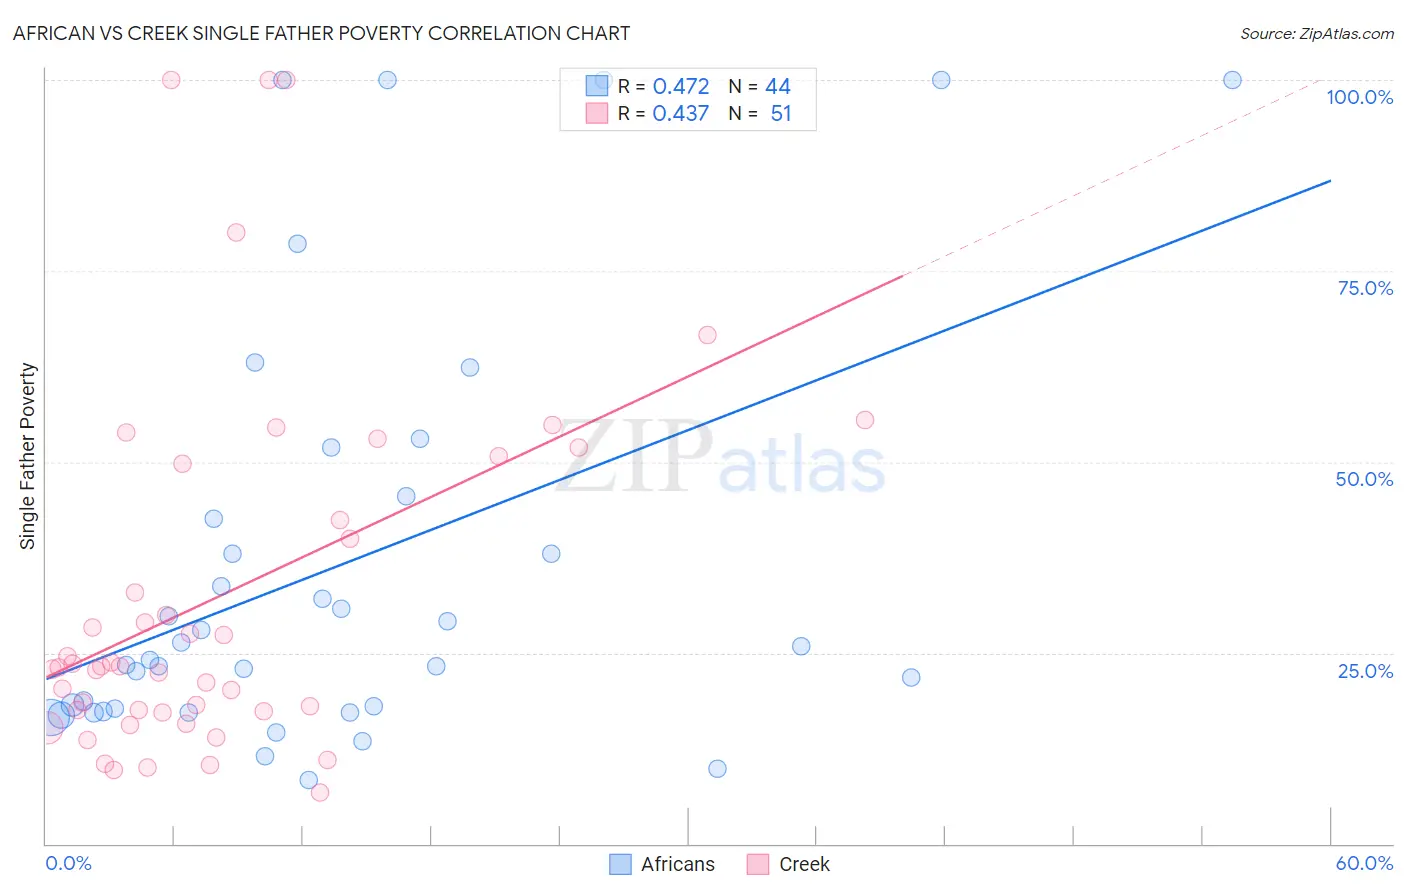
African vs Creek Single Father Poverty Correlation Chart
The statistical analysis conducted on geographies consisting of 369,651,911 people shows a moderate positive correlation between the proportion of Africans and poverty level among single fathers in the United States with a correlation coefficient (R) of 0.472 and weighted average of 18.3%. Similarly, the statistical analysis conducted on geographies consisting of 156,600,877 people shows a moderate positive correlation between the proportion of Creek and poverty level among single fathers in the United States with a correlation coefficient (R) of 0.437 and weighted average of 19.8%, a difference of 8.3%.
Single Father Poverty Correlation Summary
| Measurement | African | Creek |
| Minimum | 8.3% | 6.7% |
| Maximum | 100.0% | 100.0% |
| Range | 91.7% | 93.3% |
| Mean | 36.4% | 32.5% |
| Median | 25.0% | 23.2% |
| Interquartile 25% (IQ1) | 17.5% | 17.4% |
| Interquartile 75% (IQ3) | 44.0% | 49.8% |
| Interquartile Range (IQR) | 26.5% | 32.4% |
| Standard Deviation (Sample) | 27.5% | 23.7% |
| Standard Deviation (Population) | 27.1% | 23.5% |
Similar Demographics by Single Father Poverty
Demographics Similar to Africans by Single Father Poverty
In terms of single father poverty, the demographic groups most similar to Africans are White/Caucasian (18.4%, a difference of 0.21%), Immigrants from Dominican Republic (18.4%, a difference of 0.53%), French (18.2%, a difference of 0.75%), Hungarian (18.5%, a difference of 0.75%), and Comanche (18.5%, a difference of 0.86%).
| Demographics | Rating | Rank | Single Father Poverty |
| Alaskan Athabascans | 0.0 /100 | #291 | Tragic 18.1% |
| Immigrants | Bahamas | 0.0 /100 | #292 | Tragic 18.1% |
| Alaska Natives | 0.0 /100 | #293 | Tragic 18.1% |
| U.S. Virgin Islanders | 0.0 /100 | #294 | Tragic 18.1% |
| Yakama | 0.0 /100 | #295 | Tragic 18.1% |
| Seminole | 0.0 /100 | #296 | Tragic 18.1% |
| French | 0.0 /100 | #297 | Tragic 18.2% |
| Africans | 0.0 /100 | #298 | Tragic 18.3% |
| Whites/Caucasians | 0.0 /100 | #299 | Tragic 18.4% |
| Immigrants | Dominican Republic | 0.0 /100 | #300 | Tragic 18.4% |
| Hungarians | 0.0 /100 | #301 | Tragic 18.5% |
| Comanche | 0.0 /100 | #302 | Tragic 18.5% |
| Celtics | 0.0 /100 | #303 | Tragic 18.5% |
| Ute | 0.0 /100 | #304 | Tragic 18.5% |
| Blackfeet | 0.0 /100 | #305 | Tragic 18.5% |
Demographics Similar to Creek by Single Father Poverty
In terms of single father poverty, the demographic groups most similar to Creek are Pennsylvania German (20.0%, a difference of 0.90%), Cherokee (19.6%, a difference of 1.0%), American (20.1%, a difference of 1.1%), Inupiat (19.5%, a difference of 1.9%), and Black/African American (20.4%, a difference of 2.7%).
| Demographics | Rating | Rank | Single Father Poverty |
| Chickasaw | 0.0 /100 | #315 | Tragic 19.0% |
| Osage | 0.0 /100 | #316 | Tragic 19.0% |
| Dominicans | 0.0 /100 | #317 | Tragic 19.1% |
| Dutch West Indians | 0.0 /100 | #318 | Tragic 19.2% |
| Slovaks | 0.0 /100 | #319 | Tragic 19.3% |
| Inupiat | 0.0 /100 | #320 | Tragic 19.5% |
| Cherokee | 0.0 /100 | #321 | Tragic 19.6% |
| Creek | 0.0 /100 | #322 | Tragic 19.8% |
| Pennsylvania Germans | 0.0 /100 | #323 | Tragic 20.0% |
| Americans | 0.0 /100 | #324 | Tragic 20.1% |
| Blacks/African Americans | 0.0 /100 | #325 | Tragic 20.4% |
| Immigrants | Yemen | 0.0 /100 | #326 | Tragic 20.6% |
| Choctaw | 0.0 /100 | #327 | Tragic 20.7% |
| Pueblo | 0.0 /100 | #328 | Tragic 21.1% |
| Colville | 0.0 /100 | #329 | Tragic 21.4% |