Swedish vs Creek Single Father Poverty
COMPARE
Swedish
Creek
Single Father Poverty
Single Father Poverty Comparison
Swedes
Creek
16.3%
SINGLE FATHER POVERTY
50.0/ 100
METRIC RATING
174th/ 347
METRIC RANK
19.8%
SINGLE FATHER POVERTY
0.0/ 100
METRIC RATING
322nd/ 347
METRIC RANK
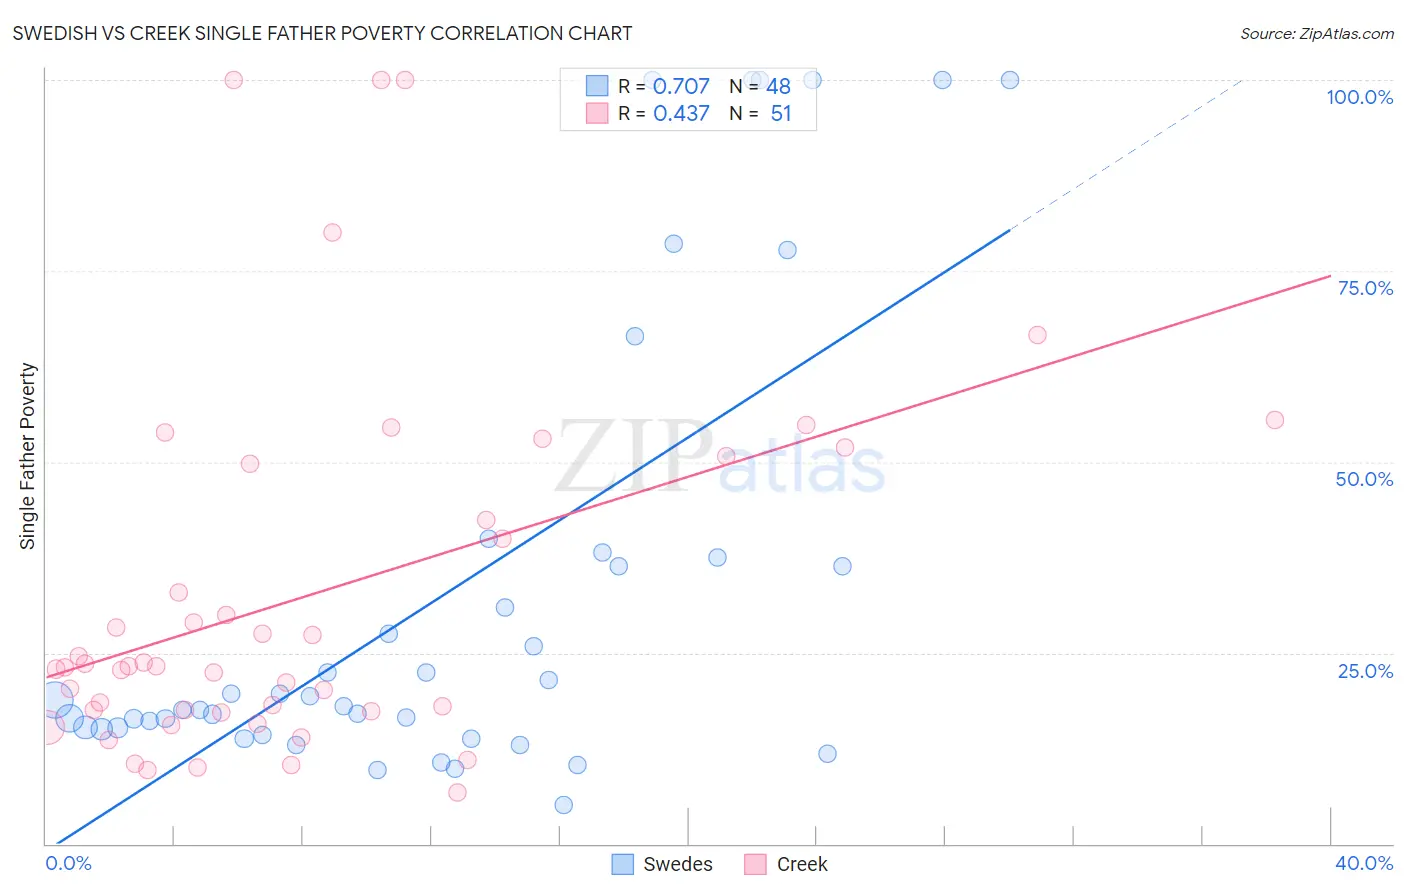
Swedish vs Creek Single Father Poverty Correlation Chart
The statistical analysis conducted on geographies consisting of 390,500,833 people shows a strong positive correlation between the proportion of Swedes and poverty level among single fathers in the United States with a correlation coefficient (R) of 0.707 and weighted average of 16.3%. Similarly, the statistical analysis conducted on geographies consisting of 156,600,877 people shows a moderate positive correlation between the proportion of Creek and poverty level among single fathers in the United States with a correlation coefficient (R) of 0.437 and weighted average of 19.8%, a difference of 21.7%.
Single Father Poverty Correlation Summary
| Measurement | Swedish | Creek |
| Minimum | 5.1% | 6.7% |
| Maximum | 100.0% | 100.0% |
| Range | 94.9% | 93.3% |
| Mean | 32.9% | 32.5% |
| Median | 18.4% | 23.2% |
| Interquartile 25% (IQ1) | 15.1% | 17.4% |
| Interquartile 75% (IQ3) | 36.9% | 49.8% |
| Interquartile Range (IQR) | 21.9% | 32.4% |
| Standard Deviation (Sample) | 30.0% | 23.7% |
| Standard Deviation (Population) | 29.7% | 23.5% |
Similar Demographics by Single Father Poverty
Demographics Similar to Swedes by Single Father Poverty
In terms of single father poverty, the demographic groups most similar to Swedes are Immigrants from Sierra Leone (16.3%, a difference of 0.0%), Immigrants from St. Vincent and the Grenadines (16.3%, a difference of 0.0%), Immigrants from Ecuador (16.3%, a difference of 0.020%), Immigrants from Morocco (16.3%, a difference of 0.030%), and Vietnamese (16.3%, a difference of 0.090%).
| Demographics | Rating | Rank | Single Father Poverty |
| Yugoslavians | 53.9 /100 | #167 | Average 16.3% |
| Costa Ricans | 53.6 /100 | #168 | Average 16.3% |
| Northern Europeans | 52.8 /100 | #169 | Average 16.3% |
| Scandinavians | 52.3 /100 | #170 | Average 16.3% |
| Immigrants | Morocco | 50.7 /100 | #171 | Average 16.3% |
| Immigrants | Sierra Leone | 50.1 /100 | #172 | Average 16.3% |
| Immigrants | St. Vincent and the Grenadines | 50.0 /100 | #173 | Average 16.3% |
| Swedes | 50.0 /100 | #174 | Average 16.3% |
| Immigrants | Ecuador | 49.7 /100 | #175 | Average 16.3% |
| Vietnamese | 48.0 /100 | #176 | Average 16.3% |
| Immigrants | South Africa | 44.2 /100 | #177 | Average 16.3% |
| Immigrants | Cuba | 41.6 /100 | #178 | Average 16.4% |
| Serbians | 40.9 /100 | #179 | Average 16.4% |
| Immigrants | Latin America | 37.2 /100 | #180 | Fair 16.4% |
| Immigrants | Western Africa | 36.0 /100 | #181 | Fair 16.4% |
Demographics Similar to Creek by Single Father Poverty
In terms of single father poverty, the demographic groups most similar to Creek are Pennsylvania German (20.0%, a difference of 0.90%), Cherokee (19.6%, a difference of 1.0%), American (20.1%, a difference of 1.1%), Inupiat (19.5%, a difference of 1.9%), and Black/African American (20.4%, a difference of 2.7%).
| Demographics | Rating | Rank | Single Father Poverty |
| Chickasaw | 0.0 /100 | #315 | Tragic 19.0% |
| Osage | 0.0 /100 | #316 | Tragic 19.0% |
| Dominicans | 0.0 /100 | #317 | Tragic 19.1% |
| Dutch West Indians | 0.0 /100 | #318 | Tragic 19.2% |
| Slovaks | 0.0 /100 | #319 | Tragic 19.3% |
| Inupiat | 0.0 /100 | #320 | Tragic 19.5% |
| Cherokee | 0.0 /100 | #321 | Tragic 19.6% |
| Creek | 0.0 /100 | #322 | Tragic 19.8% |
| Pennsylvania Germans | 0.0 /100 | #323 | Tragic 20.0% |
| Americans | 0.0 /100 | #324 | Tragic 20.1% |
| Blacks/African Americans | 0.0 /100 | #325 | Tragic 20.4% |
| Immigrants | Yemen | 0.0 /100 | #326 | Tragic 20.6% |
| Choctaw | 0.0 /100 | #327 | Tragic 20.7% |
| Pueblo | 0.0 /100 | #328 | Tragic 21.1% |
| Colville | 0.0 /100 | #329 | Tragic 21.4% |