Immigrants from Ukraine vs Scandinavian Poverty

COMPARE

Immigrants from Ukraine
Race
Ancestry
AfghanAfricanAlaska NativeAlaskan AthabascanAlbanianAleutAlsatianAmericanApacheArabArapahoArgentineanArmenianAssyrian/Chaldean/SyriacAustralianAustrianBahamianBangladeshiBarbadianBasqueBelgianBelizeanBermudanBhutaneseBlackfeetBolivianBrazilianBritishBritish West IndianBulgarianBurmeseCajunCambodianCanadianCape VerdeanCarpatho RusynCelticCentral AmericanCentral American IndianCherokeeCheyenneChickasawChileanChineseChippewaChoctawColombianColvilleComancheCosta RicanCreeCreekCroatianCrowCubanCypriotCzechCzechoslovakianDanishDelawareDominicanDutchDutch West IndianEastern EuropeanEcuadorianEgyptianEnglishEstonianEthiopianEuropeanFijianFilipinoFinnishFrenchFrench American IndianFrench CanadianGermanGerman RussianGhanaianGreekGuamanian/ChamorroGuatemalanGuyaneseHaitianHmongHonduranHopiHoumaHungarianIcelanderIndian (Asian)IndonesianInupiatIranianIraqiIrishIroquoisIsraeliItalianJamaicanJapaneseJordanianKenyanKiowaKoreanLaotianLatvianLebaneseLiberianLithuanianLumbeeLuxembourgerMacedonianMalaysianMalteseMarshalleseMenomineeMexicanMexican American IndianMongolianMoroccanNative HawaiianNavajoNepaleseNew ZealanderNicaraguanNigerianNorthern EuropeanNorwegianOkinawanOsageOttawaPaiutePakistaniPalestinianPanamanianParaguayanPennsylvania GermanPeruvianPimaPolishPortuguesePotawatomiPuebloPuerto RicanPuget Sound SalishRomanianRussianSalvadoranSamoanScotch-IrishScottishSeminoleSenegaleseSerbianShoshoneSierra LeoneanSiouxSlavicSlovakSloveneSomaliSouth AfricanSouth AmericanSouth American IndianSoviet UnionSpaniardSpanishSpanish AmericanSpanish American IndianSri LankanSubsaharan AfricanSudaneseSwedishSwissSyrianTaiwaneseThaiTlingit-HaidaTohono O'OdhamTonganTrinidadian and TobagonianTsimshianTurkishU.S. Virgin IslanderUgandanUkrainianUruguayanUteVenezuelanVietnameseWelshWest IndianYakamaYaquiYugoslavianYumanYup'ikZimbabwean
Immigration
NonimmigrantsImmigrantsAfghanistanAfricaAlbaniaArgentinaArmeniaAsiaAustraliaAustriaBahamasBangladeshBarbadosBelarusBelgiumBelizeBoliviaBosnia and HerzegovinaBrazilBulgariaBurma/MyanmarCabo VerdeCambodiaCameroonCanadaCaribbeanCentral AmericaChileChinaColombiaCongoCosta RicaCroatiaCubaCzechoslovakiaDenmarkDominicaDominican RepublicEastern AfricaEastern AsiaEastern EuropeEcuadorEgyptEl SalvadorEnglandEritreaEthiopiaEuropeFijiFranceGermanyGhanaGreeceGrenadaGuatemalaGuyanaHaitiHondurasHong KongHungaryIndiaIndonesiaIranIraqIrelandIsraelItalyJamaicaJapanJordanKazakhstanKenyaKoreaKuwaitLaosLatin AmericaLatviaLebanonLiberiaLithuaniaMalaysiaMexicoMicronesiaMiddle AfricaMoldovaMoroccoNepalNetherlandsNicaraguaNigeriaNorth AmericaNorth MacedoniaNorthern AfricaNorthern EuropeNorwayOceaniaPakistanPanamaPeruPhilippinesPolandPortugalRomaniaRussiaSaudi ArabiaScotlandSenegalSerbiaSierra LeoneSingaporeSomaliaSouth AfricaSouth AmericaSouth Central AsiaSouth Eastern AsiaSouthern EuropeSpainSri LankaSt. Vincent and the GrenadinesSudanSwedenSwitzerlandSyriaTaiwanThailandTrinidad and TobagoTurkeyUgandaUkraineUruguayUzbekistanVenezuelaVietnamWest IndiesWestern AfricaWestern AsiaWestern EuropeYemenZaireZimbabweAzores
Scandinavian
Race
Ancestry
AfghanAfricanAlaska NativeAlaskan AthabascanAlbanianAleutAlsatianAmericanApacheArabArapahoArgentineanArmenianAssyrian/Chaldean/SyriacAustralianAustrianBahamianBangladeshiBarbadianBasqueBelgianBelizeanBermudanBhutaneseBlackfeetBolivianBrazilianBritishBritish West IndianBulgarianBurmeseCajunCambodianCanadianCape VerdeanCarpatho RusynCelticCentral AmericanCentral American IndianCherokeeCheyenneChickasawChileanChineseChippewaChoctawColombianColvilleComancheCosta RicanCreeCreekCroatianCrowCubanCypriotCzechCzechoslovakianDanishDelawareDominicanDutchDutch West IndianEastern EuropeanEcuadorianEgyptianEnglishEstonianEthiopianEuropeanFijianFilipinoFinnishFrenchFrench American IndianFrench CanadianGermanGerman RussianGhanaianGreekGuamanian/ChamorroGuatemalanGuyaneseHaitianHmongHonduranHopiHoumaHungarianIcelanderIndian (Asian)IndonesianInupiatIranianIraqiIrishIroquoisIsraeliItalianJamaicanJapaneseJordanianKenyanKiowaKoreanLaotianLatvianLebaneseLiberianLithuanianLumbeeLuxembourgerMacedonianMalaysianMalteseMarshalleseMenomineeMexicanMexican American IndianMongolianMoroccanNative HawaiianNavajoNepaleseNew ZealanderNicaraguanNigerianNorthern EuropeanNorwegianOkinawanOsageOttawaPaiutePakistaniPalestinianPanamanianParaguayanPennsylvania GermanPeruvianPimaPolishPortuguesePotawatomiPuebloPuerto RicanPuget Sound SalishRomanianRussianSalvadoranSamoanScandinavianScotch-IrishScottishSeminoleSenegaleseSerbianShoshoneSierra LeoneanSiouxSlavicSlovakSloveneSomaliSouth AfricanSouth AmericanSouth American IndianSoviet UnionSpaniardSpanishSpanish AmericanSpanish American IndianSri LankanSubsaharan AfricanSudaneseSwedishSwissSyrianTaiwaneseThaiTlingit-HaidaTohono O'OdhamTonganTrinidadian and TobagonianTsimshianTurkishU.S. Virgin IslanderUgandanUkrainianUruguayanUteVenezuelanVietnameseWelshWest IndianYakamaYaquiYugoslavianYumanYup'ikZimbabwean
Immigration
NonimmigrantsImmigrantsAfghanistanAfricaAlbaniaArgentinaArmeniaAsiaAustraliaAustriaBahamasBangladeshBarbadosBelarusBelgiumBelizeBoliviaBosnia and HerzegovinaBrazilBulgariaBurma/MyanmarCabo VerdeCambodiaCameroonCanadaCaribbeanCentral AmericaChileChinaColombiaCongoCosta RicaCroatiaCubaCzechoslovakiaDenmarkDominicaDominican RepublicEastern AfricaEastern AsiaEastern EuropeEcuadorEgyptEl SalvadorEnglandEritreaEthiopiaEuropeFijiFranceGermanyGhanaGreeceGrenadaGuatemalaGuyanaHaitiHondurasHong KongHungaryIndiaIndonesiaIranIraqIrelandIsraelItalyJamaicaJapanJordanKazakhstanKenyaKoreaKuwaitLaosLatin AmericaLatviaLebanonLiberiaLithuaniaMalaysiaMexicoMicronesiaMiddle AfricaMoldovaMoroccoNepalNetherlandsNicaraguaNigeriaNorth AmericaNorth MacedoniaNorthern AfricaNorthern EuropeNorwayOceaniaPakistanPanamaPeruPhilippinesPolandPortugalRomaniaRussiaSaudi ArabiaScotlandSenegalSerbiaSierra LeoneSingaporeSomaliaSouth AfricaSouth AmericaSouth Central AsiaSouth Eastern AsiaSouthern EuropeSpainSri LankaSt. Vincent and the GrenadinesSudanSwedenSwitzerlandSyriaTaiwanThailandTrinidad and TobagoTurkeyUgandaUruguayUzbekistanVenezuelaVietnamWest IndiesWestern AfricaWestern AsiaWestern EuropeYemenZaireZimbabweAzores
Poverty
Income
Poverty
Unemployment
Labor Participation
Family Structure
Vehicle Availability
Education Level
Disability

Poverty Comparison

Immigrants from Ukraine

Scandinavians

Excellent
Exceptional
11.8%
POVERTY
86.6/ 100
METRIC RATING
130th/ 347
METRIC RANK
11.1%
POVERTY
98.2/ 100
METRIC RATING
57th/ 347
METRIC RANK

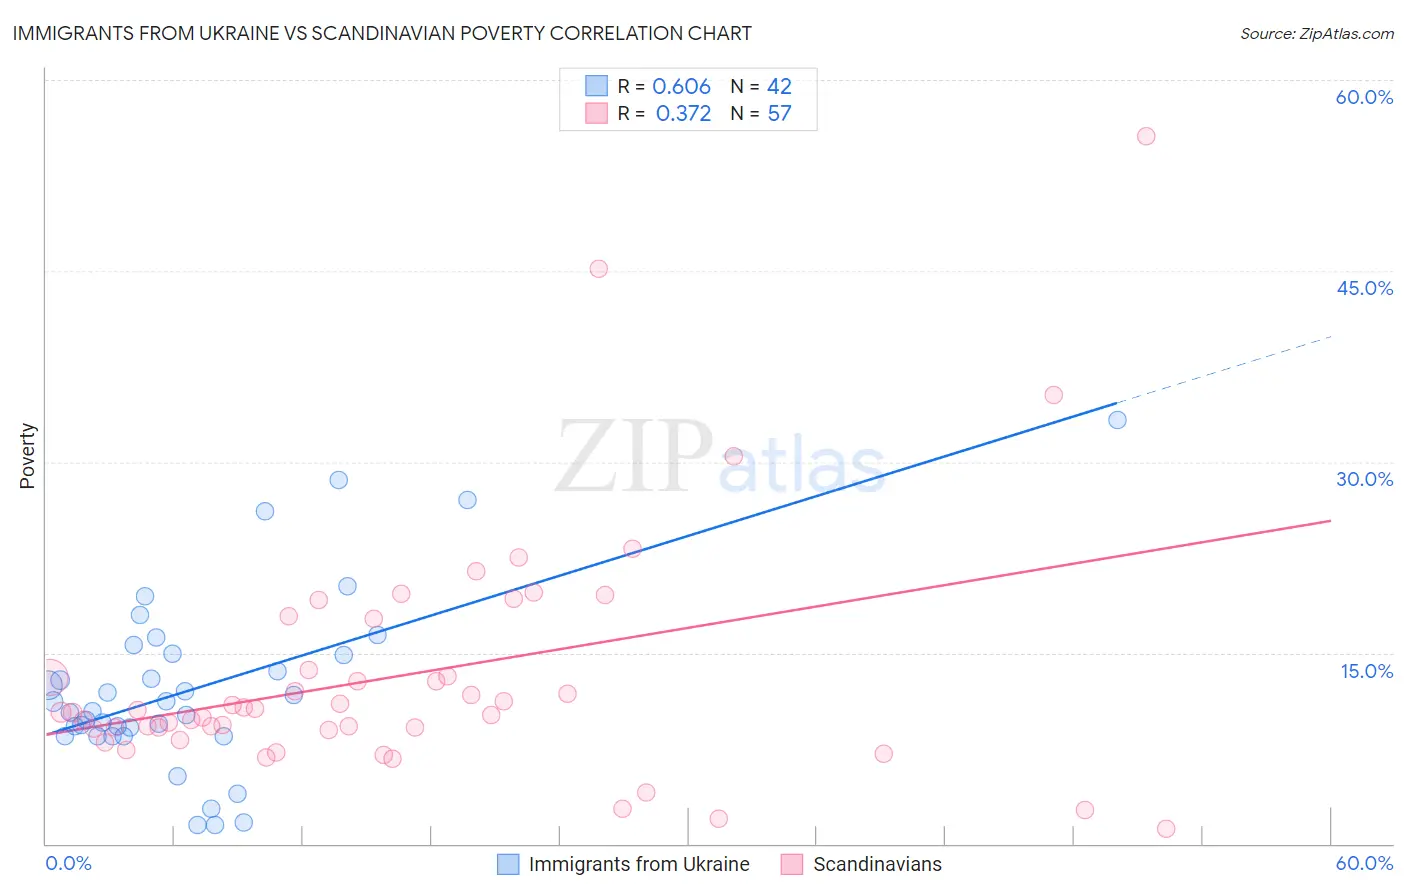
Immigrants from Ukraine vs Scandinavian Poverty Correlation Chart

The statistical analysis conducted on geographies consisting of 289,636,773 people shows a significant positive correlation between the proportion of Immigrants from Ukraine and poverty level in the United States with a correlation coefficient (R) of 0.606 and weighted average of 11.8%. Similarly, the statistical analysis conducted on geographies consisting of 472,236,083 people shows a mild positive correlation between the proportion of Scandinavians and poverty level in the United States with a correlation coefficient (R) of 0.372 and weighted average of 11.1%, a difference of 5.7%.
Immigrants from Ukraine vs Scandinavian Poverty

Poverty Correlation Summary

MeasurementImmigrants from UkraineScandinavian
Minimum1.5%1.1%
Maximum33.3%55.6%
Range31.9%54.4%
Mean12.3%13.2%
Median10.8%10.3%
Interquartile 25% (IQ1)8.5%9.0%
Interquartile 75% (IQ3)15.0%15.7%
Interquartile Range (IQR)6.5%6.7%
Standard Deviation (Sample)7.0%9.6%
Standard Deviation (Population)6.9%9.6%

Similar Demographics by Poverty

Demographics Similar to Immigrants from Ukraine by Poverty

In terms of poverty, the demographic groups most similar to Immigrants from Ukraine are South African (11.7%, a difference of 0.090%), French (11.8%, a difference of 0.10%), Immigrants from Israel (11.7%, a difference of 0.19%), Peruvian (11.8%, a difference of 0.21%), and Immigrants from Western Europe (11.8%, a difference of 0.29%).
DemographicsRating | RankPoverty
Immigrants | Hungary
88.6
/100
|
#123
Excellent
11.7%
Soviet Union
88.4
/100
|
#124
Excellent
11.7%
Immigrants | Brazil
88.2
/100
|
#125
Excellent
11.7%
Immigrants | Norway
88.0
/100
|
#126
Excellent
11.7%
Immigrants | Argentina
88.0
/100
|
#127
Excellent
11.7%
Immigrants | Israel
87.4
/100
|
#128
Excellent
11.7%
South Africans
87.0
/100
|
#129
Excellent
11.7%
Immigrants | Ukraine
86.6
/100
|
#130
Excellent
11.8%
French
86.1
/100
|
#131
Excellent
11.8%
Peruvians
85.6
/100
|
#132
Excellent
11.8%
Immigrants | Western Europe
85.2
/100
|
#133
Excellent
11.8%
Yugoslavians
85.2
/100
|
#134
Excellent
11.8%
Immigrants | Vietnam
85.2
/100
|
#135
Excellent
11.8%
Chileans
84.2
/100
|
#136
Excellent
11.8%
Immigrants | Switzerland
83.0
/100
|
#137
Excellent
11.8%

Demographics Similar to Scandinavians by Poverty

In terms of poverty, the demographic groups most similar to Scandinavians are Estonian (11.1%, a difference of 0.040%), German (11.1%, a difference of 0.060%), Immigrants from Europe (11.2%, a difference of 0.21%), Immigrants from Sri Lanka (11.2%, a difference of 0.37%), and Immigrants from Italy (11.2%, a difference of 0.44%).
DemographicsRating | RankPoverty
Asians
98.9
/100
|
#50
Exceptional
11.0%
Immigrants | Croatia
98.7
/100
|
#51
Exceptional
11.0%
Immigrants | Philippines
98.7
/100
|
#52
Exceptional
11.0%
Immigrants | Austria
98.6
/100
|
#53
Exceptional
11.1%
Immigrants | Bulgaria
98.5
/100
|
#54
Exceptional
11.1%
Immigrants | Serbia
98.5
/100
|
#55
Exceptional
11.1%
Estonians
98.2
/100
|
#56
Exceptional
11.1%
Scandinavians
98.2
/100
|
#57
Exceptional
11.1%
Germans
98.1
/100
|
#58
Exceptional
11.1%
Immigrants | Europe
98.0
/100
|
#59
Exceptional
11.2%
Immigrants | Sri Lanka
97.9
/100
|
#60
Exceptional
11.2%
Immigrants | Italy
97.9
/100
|
#61
Exceptional
11.2%
Austrians
97.8
/100
|
#62
Exceptional
11.2%
Ukrainians
97.8
/100
|
#63
Exceptional
11.2%
Swiss
97.7
/100
|
#64
Exceptional
11.2%