Bahamian vs Scandinavian Poverty
COMPARE
Bahamian
Scandinavian
Poverty
Poverty Comparison
Bahamians
Scandinavians
15.4%
POVERTY
0.0/ 100
METRIC RATING
301st/ 347
METRIC RANK
11.1%
POVERTY
98.2/ 100
METRIC RATING
57th/ 347
METRIC RANK
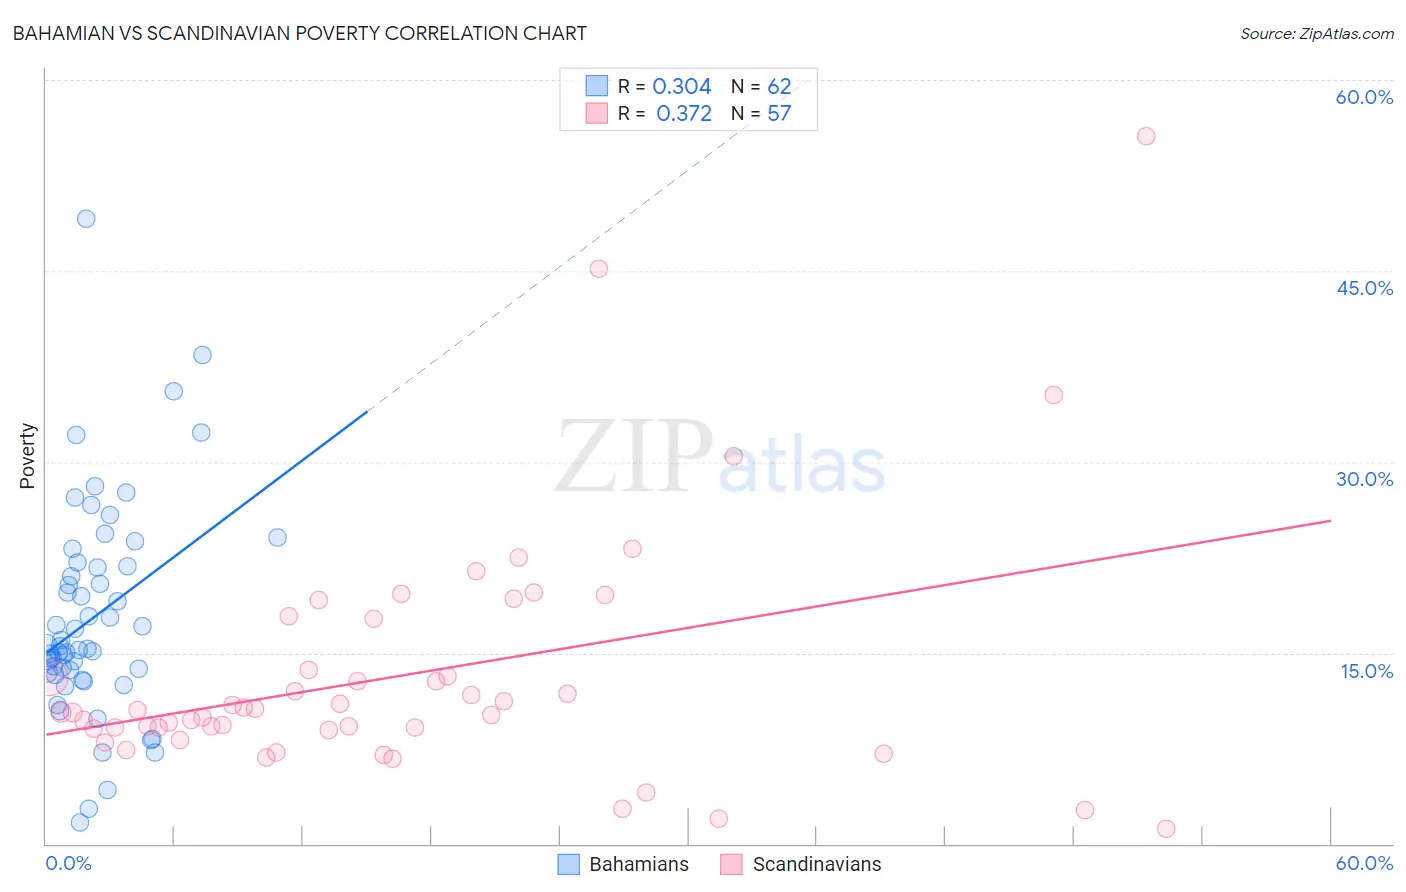
Bahamian vs Scandinavian Poverty Correlation Chart
The statistical analysis conducted on geographies consisting of 112,639,225 people shows a mild positive correlation between the proportion of Bahamians and poverty level in the United States with a correlation coefficient (R) of 0.304 and weighted average of 15.4%. Similarly, the statistical analysis conducted on geographies consisting of 472,236,083 people shows a mild positive correlation between the proportion of Scandinavians and poverty level in the United States with a correlation coefficient (R) of 0.372 and weighted average of 11.1%, a difference of 38.3%.
Poverty Correlation Summary
| Measurement | Bahamian | Scandinavian |
| Minimum | 1.7% | 1.1% |
| Maximum | 49.1% | 55.6% |
| Range | 47.4% | 54.4% |
| Mean | 17.8% | 13.2% |
| Median | 15.4% | 10.3% |
| Interquartile 25% (IQ1) | 13.4% | 9.0% |
| Interquartile 75% (IQ3) | 21.8% | 15.7% |
| Interquartile Range (IQR) | 8.4% | 6.7% |
| Standard Deviation (Sample) | 8.5% | 9.6% |
| Standard Deviation (Population) | 8.4% | 9.6% |
Similar Demographics by Poverty
Demographics Similar to Bahamians by Poverty
In terms of poverty, the demographic groups most similar to Bahamians are Somali (15.4%, a difference of 0.13%), Immigrants from Central America (15.4%, a difference of 0.21%), Senegalese (15.3%, a difference of 0.59%), Immigrants from Caribbean (15.5%, a difference of 0.61%), and Immigrants from Senegal (15.3%, a difference of 0.68%).
| Demographics | Rating | Rank | Poverty |
| Blackfeet | 0.0 /100 | #294 | Tragic 15.2% |
| Guatemalans | 0.0 /100 | #295 | Tragic 15.3% |
| Hispanics or Latinos | 0.0 /100 | #296 | Tragic 15.3% |
| Immigrants | Bangladesh | 0.0 /100 | #297 | Tragic 15.3% |
| Immigrants | Senegal | 0.0 /100 | #298 | Tragic 15.3% |
| Senegalese | 0.0 /100 | #299 | Tragic 15.3% |
| Immigrants | Central America | 0.0 /100 | #300 | Tragic 15.4% |
| Bahamians | 0.0 /100 | #301 | Tragic 15.4% |
| Somalis | 0.0 /100 | #302 | Tragic 15.4% |
| Immigrants | Caribbean | 0.0 /100 | #303 | Tragic 15.5% |
| Immigrants | Mexico | 0.0 /100 | #304 | Tragic 15.5% |
| Immigrants | Guatemala | 0.0 /100 | #305 | Tragic 15.5% |
| Creek | 0.0 /100 | #306 | Tragic 15.6% |
| Africans | 0.0 /100 | #307 | Tragic 15.6% |
| Choctaw | 0.0 /100 | #308 | Tragic 15.6% |
Demographics Similar to Scandinavians by Poverty
In terms of poverty, the demographic groups most similar to Scandinavians are Estonian (11.1%, a difference of 0.040%), German (11.1%, a difference of 0.060%), Immigrants from Europe (11.2%, a difference of 0.21%), Immigrants from Sri Lanka (11.2%, a difference of 0.37%), and Immigrants from Italy (11.2%, a difference of 0.44%).
| Demographics | Rating | Rank | Poverty |
| Asians | 98.9 /100 | #50 | Exceptional 11.0% |
| Immigrants | Croatia | 98.7 /100 | #51 | Exceptional 11.0% |
| Immigrants | Philippines | 98.7 /100 | #52 | Exceptional 11.0% |
| Immigrants | Austria | 98.6 /100 | #53 | Exceptional 11.1% |
| Immigrants | Bulgaria | 98.5 /100 | #54 | Exceptional 11.1% |
| Immigrants | Serbia | 98.5 /100 | #55 | Exceptional 11.1% |
| Estonians | 98.2 /100 | #56 | Exceptional 11.1% |
| Scandinavians | 98.2 /100 | #57 | Exceptional 11.1% |
| Germans | 98.1 /100 | #58 | Exceptional 11.1% |
| Immigrants | Europe | 98.0 /100 | #59 | Exceptional 11.2% |
| Immigrants | Sri Lanka | 97.9 /100 | #60 | Exceptional 11.2% |
| Immigrants | Italy | 97.9 /100 | #61 | Exceptional 11.2% |
| Austrians | 97.8 /100 | #62 | Exceptional 11.2% |
| Ukrainians | 97.8 /100 | #63 | Exceptional 11.2% |
| Swiss | 97.7 /100 | #64 | Exceptional 11.2% |